 Download:
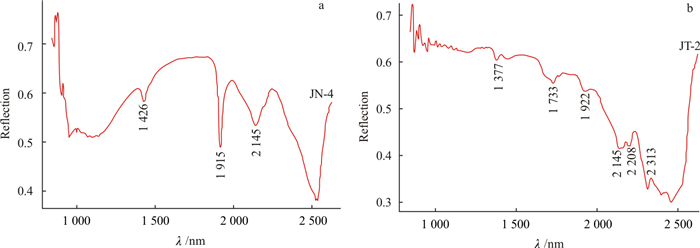
Spectral information of natural jadeite sample JN-4 (a) and polymer-impregnated jadeite sample JT-2 (b) in 1 000-2 500 nm band
Figures of the Article
-
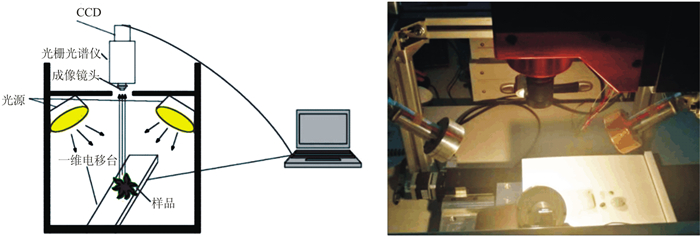
![]() Schematic of hyperspectral imaging system(a) and small imaging spectrometer scanning(b)
Schematic of hyperspectral imaging system(a) and small imaging spectrometer scanning(b)
-
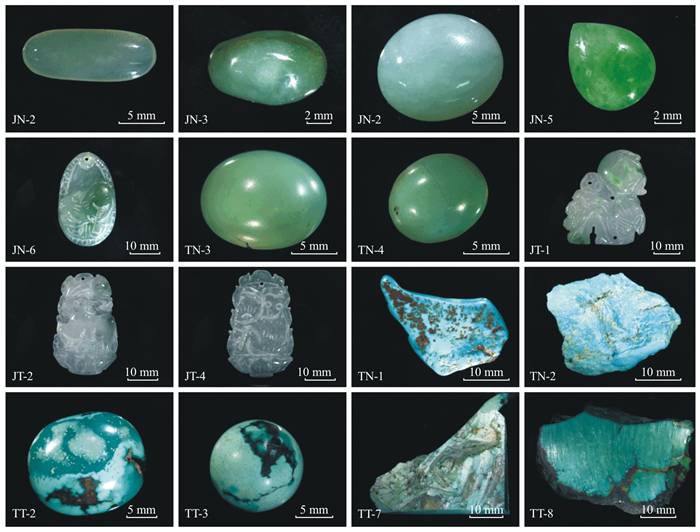
![]() Some jadeite and turquoise samples
Some jadeite and turquoise samples
-
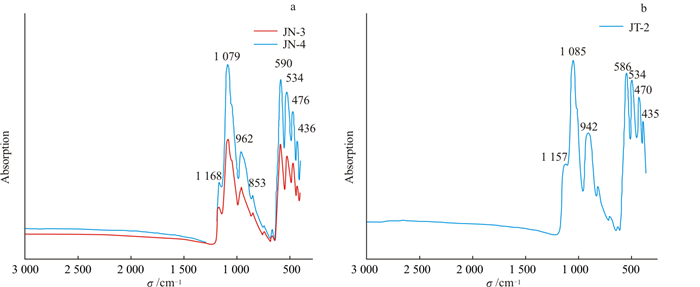
![]() MIR spectra of natural jadeite samples (a) and polymer-impregnated jadeite sample (b)
MIR spectra of natural jadeite samples (a) and polymer-impregnated jadeite sample (b)
-
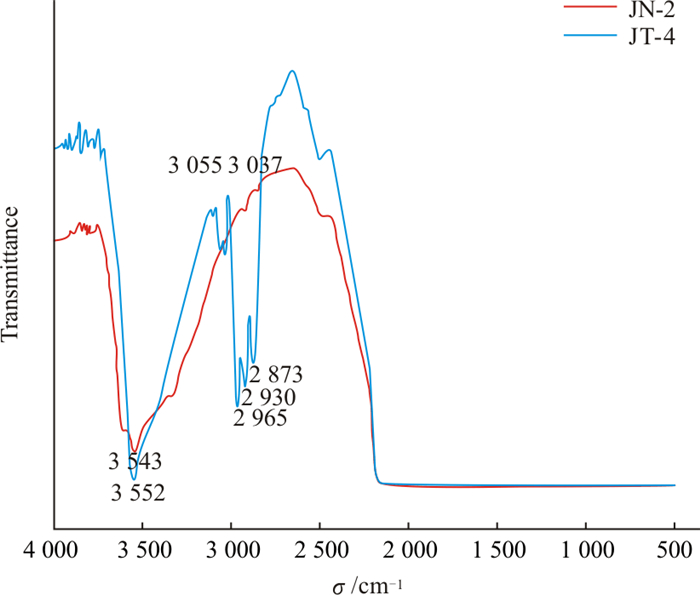
![]() MIR spectra of natural jadeite sample JN-2 and polymer-impregnated jadeite sample JT-4
MIR spectra of natural jadeite sample JN-2 and polymer-impregnated jadeite sample JT-4
-
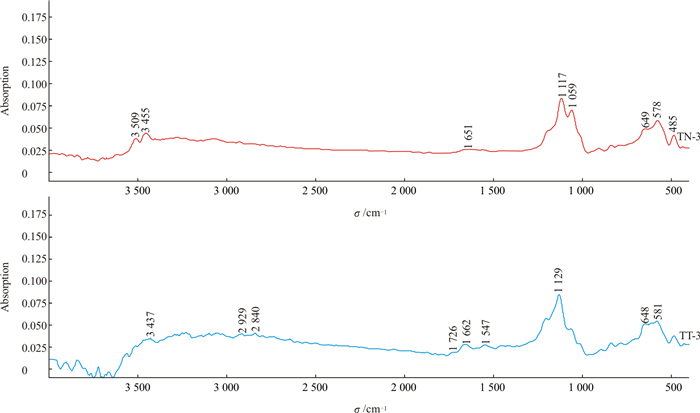
![]() MIR spectra of natural turquoise sample TN-3 and polymer-impregnated turquoise sample TT-3
MIR spectra of natural turquoise sample TN-3 and polymer-impregnated turquoise sample TT-3
-
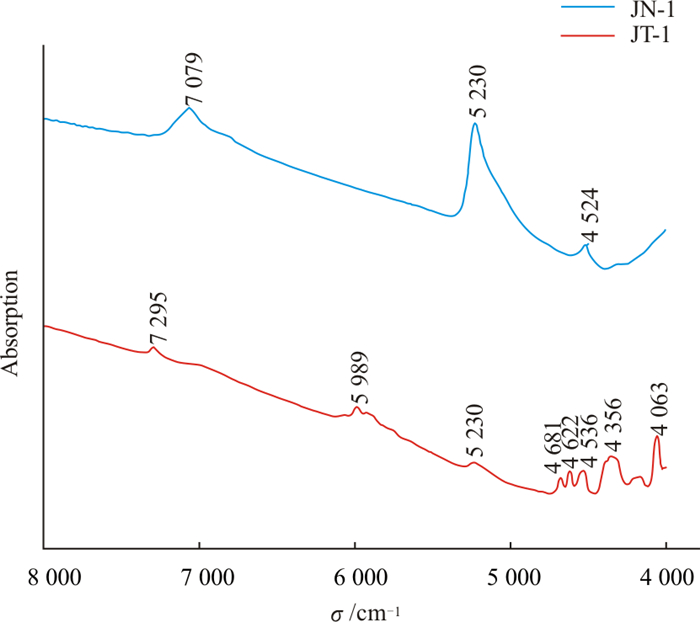
![]() NIR spectra of natural jadeite and polymer-impregnated jadeite samples
NIR spectra of natural jadeite and polymer-impregnated jadeite samples
-
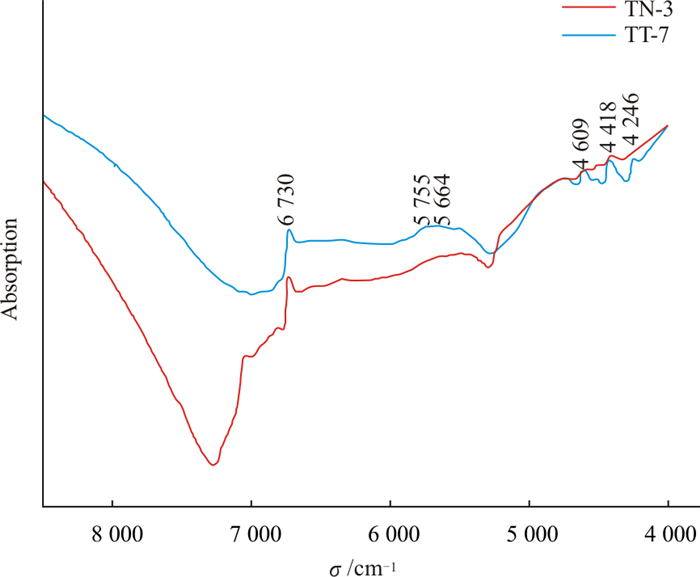
![]() NIR spectra of natural turquoise and polymer-impregnated turquoise samples
NIR spectra of natural turquoise and polymer-impregnated turquoise samples
-
![]() Spectral information of natural jadeite sample JN-4 (a) and polymer-impregnated jadeite sample JT-2 (b) in 1 000-2 500 nm band
Spectral information of natural jadeite sample JN-4 (a) and polymer-impregnated jadeite sample JT-2 (b) in 1 000-2 500 nm band
-
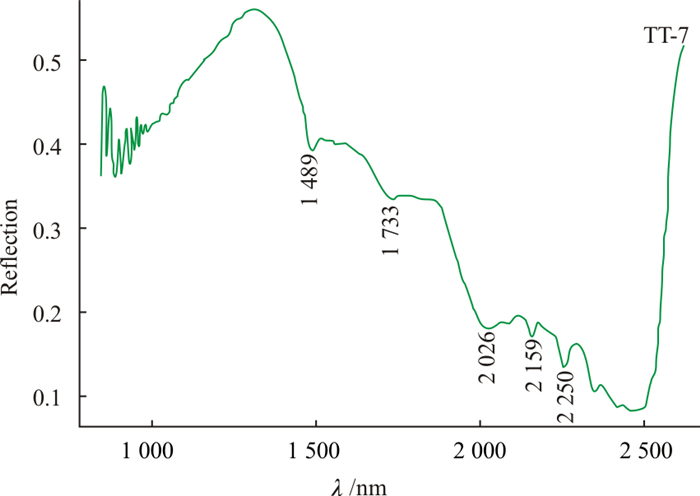
![]() Spectral information of polymer-impregnated turquoise sample TT-7 in 1 000-2 500 nm
Spectral information of polymer-impregnated turquoise sample TT-7 in 1 000-2 500 nm
-
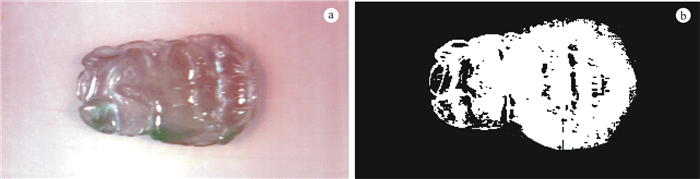
![]() Psedo-colour images of jadeite sample (a) and its distribution of abnormal points (b) in 1 000-2 500 nm
Psedo-colour images of jadeite sample (a) and its distribution of abnormal points (b) in 1 000-2 500 nm
-
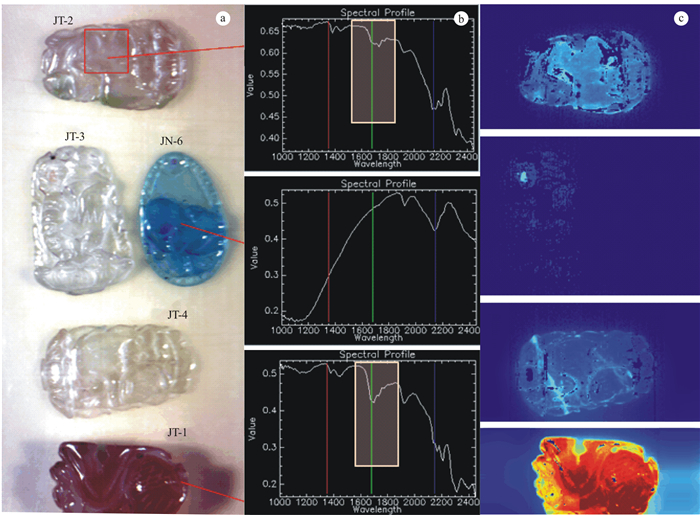
![]() Pseudo-colour images (a), NIR spectra (b) and distribution of polymer (c) of jadeite
Pseudo-colour images (a), NIR spectra (b) and distribution of polymer (c) of jadeite
-
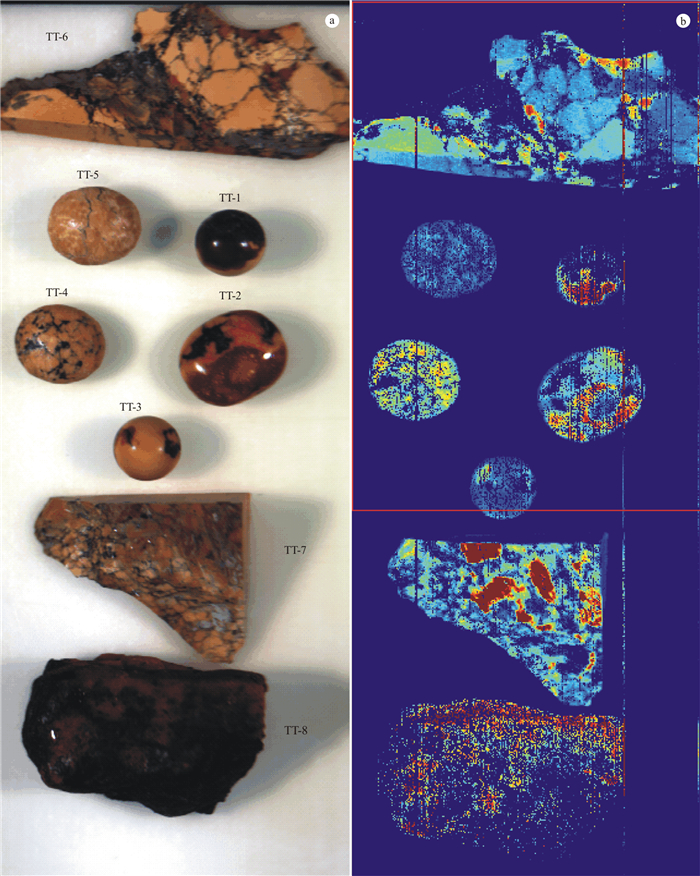
![]() Pseudo-colour images of turquoise samples (a) and distribution of polymer (b)
Pseudo-colour images of turquoise samples (a) and distribution of polymer (b)