 Download:
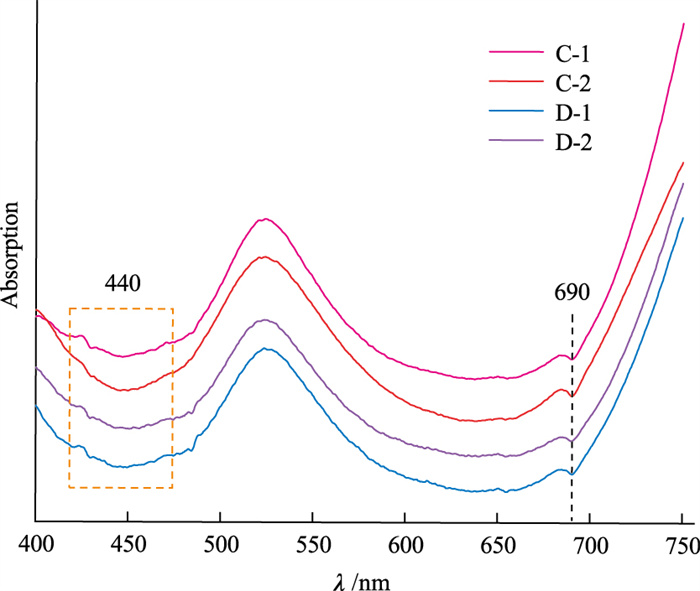
UV-Vis absorption spectra of synthetic jadeite samples of group C and D
Figures of the Article
-
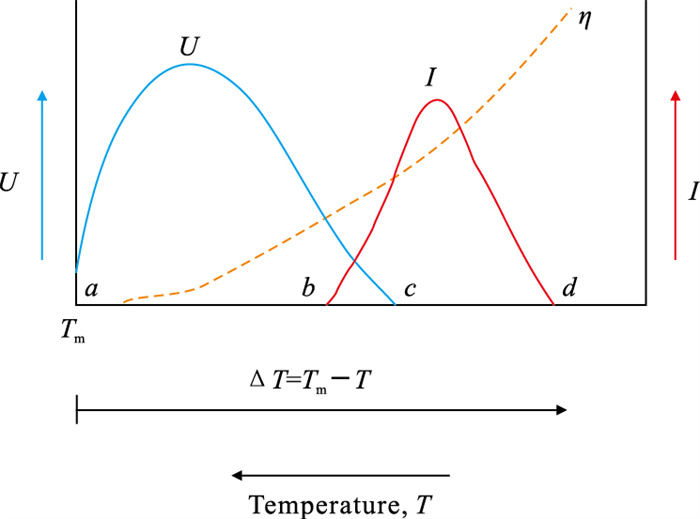
![]() The relationship between nucleation rate, crystallization rate and temperature
The relationship between nucleation rate, crystallization rate and temperature
-
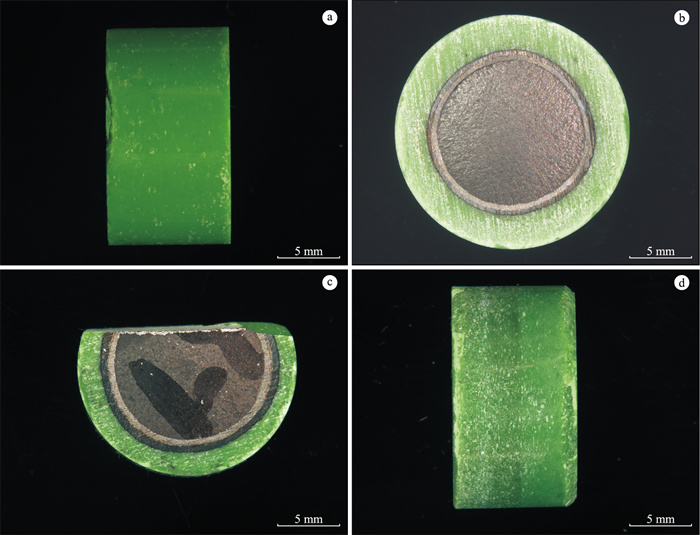
![]() Appearance of synthetic jadeite samples of group A and B
Appearance of synthetic jadeite samples of group A and B
-
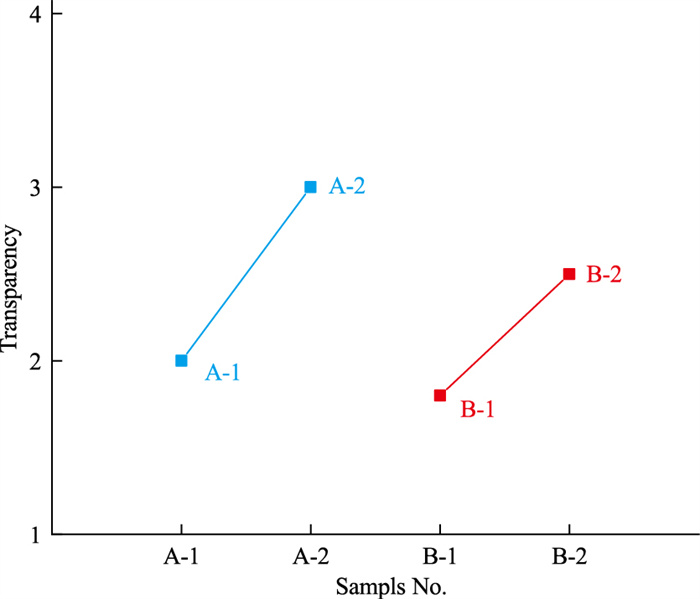
![]() Transparency diagram of synthetic jadeite samples of group A and B
Transparency diagram of synthetic jadeite samples of group A and B
-
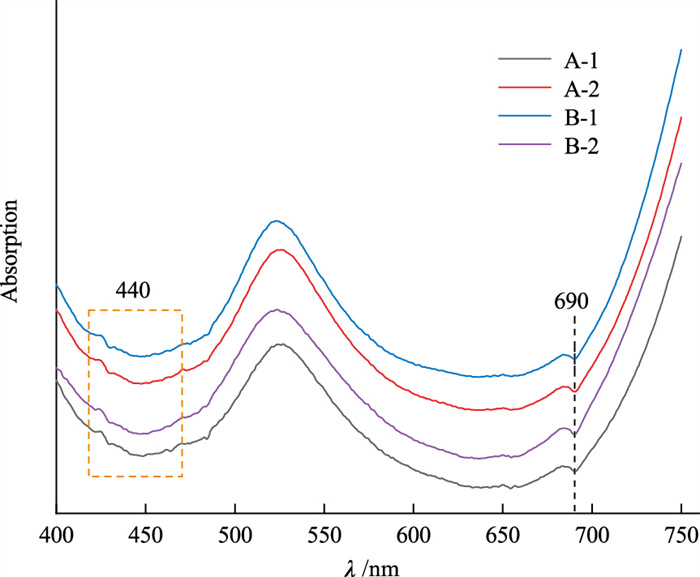
![]() UV-Vis absorption spectra of synthetic jadeite samples of group A and B
UV-Vis absorption spectra of synthetic jadeite samples of group A and B
-
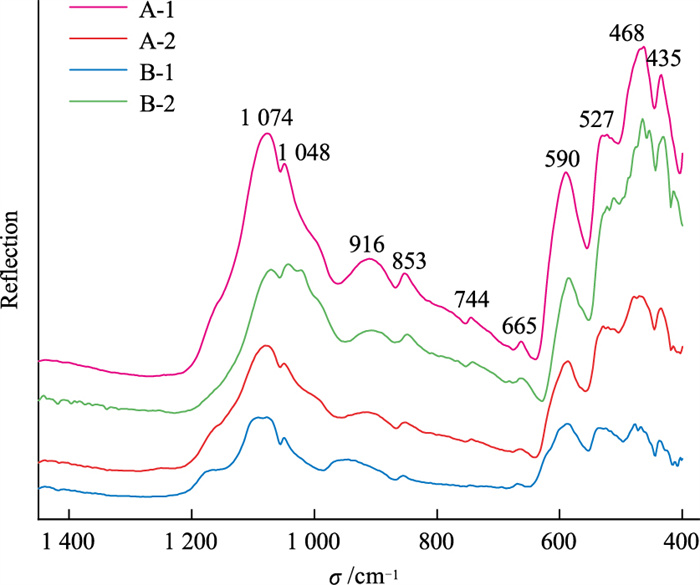
![]() FTIR reflection spectra of synthetic jadeite samples of group A and B
FTIR reflection spectra of synthetic jadeite samples of group A and B
-
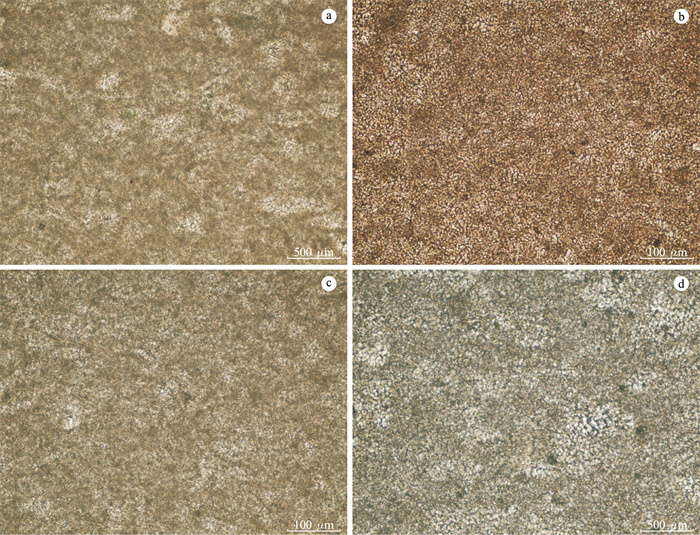
![]() Microstructure of synthetic jadeite samples of group A and B
Microstructure of synthetic jadeite samples of group A and B
-
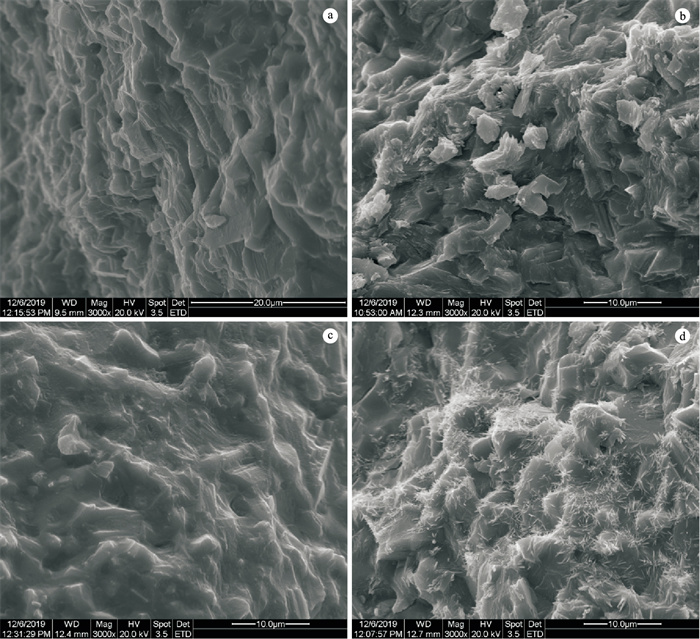
![]() SEM images of synthetic jadeite samples of group A and B
SEM images of synthetic jadeite samples of group A and B
-
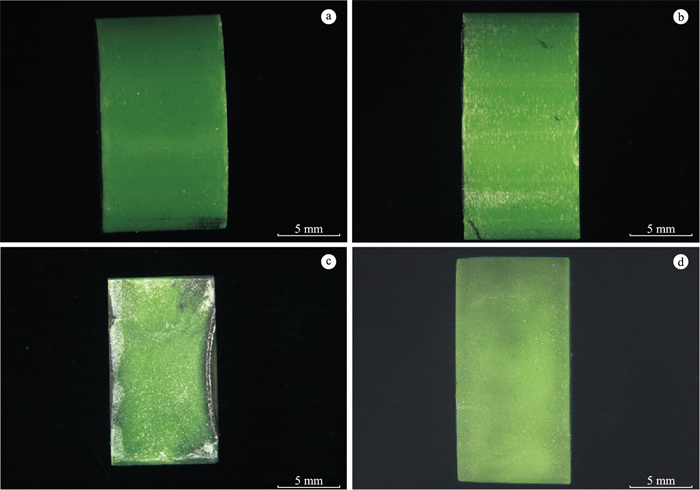
![]() Appearance of synthetic jadeite samples of group C and D
Appearance of synthetic jadeite samples of group C and D
-
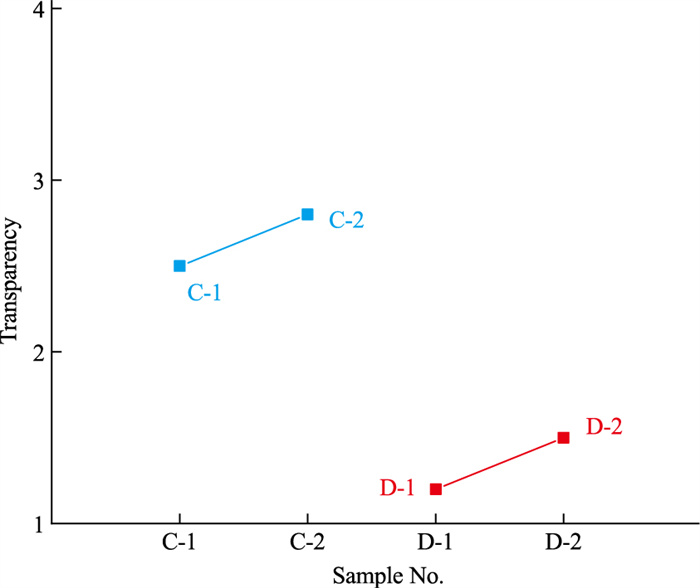
![]() Transparency diagram of synthetic jadeite samples of group C and D
Transparency diagram of synthetic jadeite samples of group C and D
-
![]() UV-Vis absorption spectra of synthetic jadeite samples of group C and D
UV-Vis absorption spectra of synthetic jadeite samples of group C and D
-
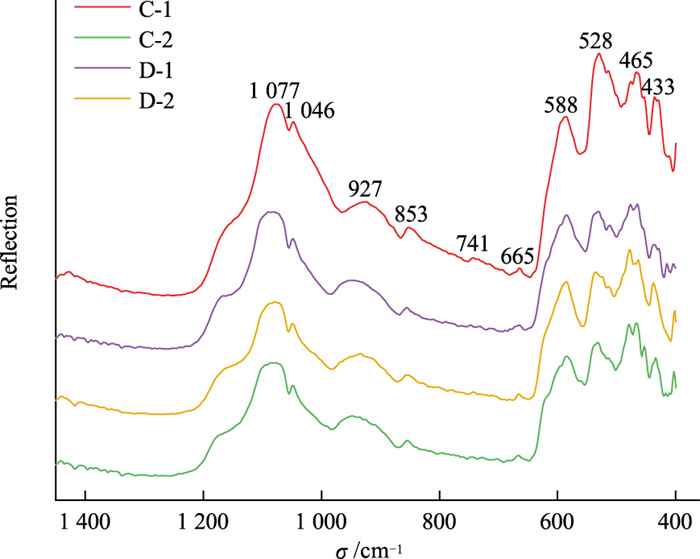
![]() FTIR reflection spectra of synthetic jadeite samples of group C and D
FTIR reflection spectra of synthetic jadeite samples of group C and D
-
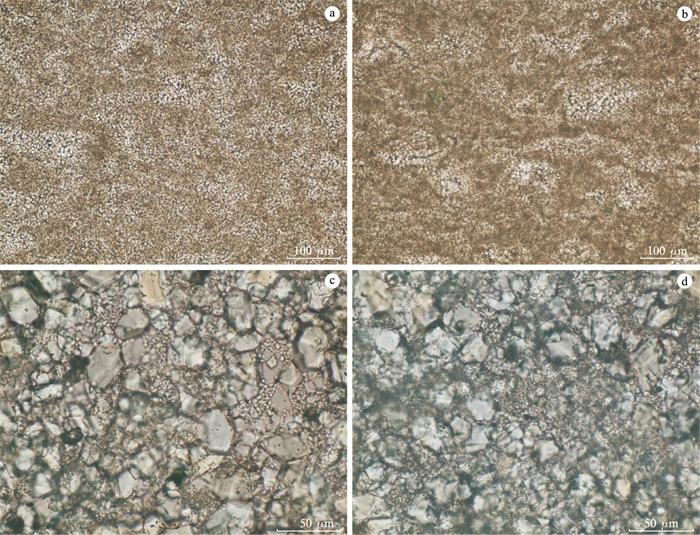
![]() Microstructures of synthetic jadeite samples of group C and D
Microstructures of synthetic jadeite samples of group C and D
-
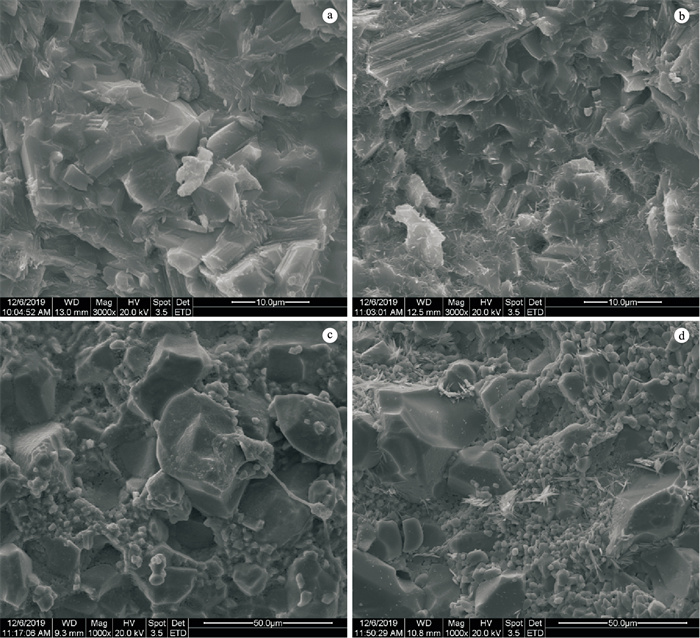
![]() SEM images of synthetic jadeite samples of group C and D
SEM images of synthetic jadeite samples of group C and D
Related articles
-
2024, 26(S1): 6-9.
-
2021, 23(6): 51-57. DOI: 10.15964/j.cnki.027jgg.2021.06.005
-
2021, 23(6): 12-24. DOI: 10.15964/j.cnki.027jgg.2021.06.002
-
2019, 21(S1): 1-3. DOI: 10.15964/j.cnki.027jgg.2019.S1.001
-
2019, 21(1): 31-39. DOI: 10.15964/j.cnki.027jgg.2019.01.004
-
2018, 20(3): 1-8. DOI: 10.15964/j.cnki.027jgg.2018.03.001
-
2016, 18(3): 1-8.
-
2015, 17(5): 12-17.
-
2014, 16(5): 28-33.
-
2004, 6(4): 22-24,31.