BAO Peijin, CHEN Quanli, HUANG Huizhen. Identification of the Origin of Emerald Based on SPSS Factor Analysis and Discriminant Analysis[J]. Journal of Gems & Gemmology, 2023, 25(6): 76-83. DOI: 10.15964/j.cnki.027jgg.2023.06.007
Citation: BAO Peijin, CHEN Quanli, HUANG Huizhen. Identification of the Origin of Emerald Based on SPSS Factor Analysis and Discriminant Analysis[J]. Journal of Gems & Gemmology, 2023, 25(6): 76-83. DOI: 10.15964/j.cnki.027jgg.2023.06.007

Identification of the Origin of Emerald Based on SPSS Factor Analysis and Discriminant Analysis

More Information
  • Received Date: March 04, 2023
  • The geographic origin tracing of gemstones has always been an important topic of concern in jewelry industry. The origin of gems is closely related to price, and the development of computer and artificial intelligence makes it possible to use mathematical models in this field. In order to study the origin determination methods of the same kind of gemstones from different areas and eliminate the subjectivity, empiricism and uncontrollability of traditional origin determination methods, this study used the chemical composition data of emerald from different areas summarized by self-test and predecessors. Factor analysis and discriminant analysis were combined with SPSS to discriminate the origin of 242 emerald samples from nine different areas such as Zambia, Australia, Colombia, Madagascar, Pakistan etc. The experimental variables are the content of Li, Na, K, Rb, Cs, Sc and the Ga and the results show that: (1) Multicollinearity analysis of factor analysis and linear regression can be obtained, there is no obvious multicollinearity between these seven groups of element variables, and the KMO value of factor analysis is slightly less than 0.6, that is, the correlation between them is not obvious; (2) Discriminant analysis shows that the correct rate of back generation to distinguish the origin of emeralds from the nine producing areas by using these element contents is 95.9%, the correct rate of cross-validation is 91.7%, and the discriminant model has a high correct rate of discrimination and it has a good degree of discrimination. Therefore, it has great potential to use the alkali metal chemical elements in emeralds from different origins as variables to establish a discriminant model to trace their origins.

  • 宝石学家对宝石产地溯源的研究由来已久,经典的宝石产地在消费者心中有着不可替代的地位,同时也影响着宝石的价格和市场需求。

    祖母绿是绿柱石矿物中最为名贵的品种,享有“绿色宝石之王”的美称,它与钻石、红宝石、蓝宝石、金绿宝石并称为“五大宝石”。世界上的祖母绿产地众多,在五大洲均有发现,其中最主要的大区是南美洲和非洲[1]。目前市场上销售的祖母绿大多来自南美洲的哥伦比亚和巴西,非洲的赞比亚,亚洲的巴基斯坦、阿富汗等[2]。其中,哥伦比亚的木佐矿区是最著名的祖母绿矿区,一颗祖母绿若被定为哥伦比亚产区,其价格会高出其它产地祖母绿的30%~40%。

    祖母绿属于绿柱石家族,由于致色元素Cr、V、Fe的类质同象替代作用,无色的绿柱石拥有了璀璨的绿色,并称为祖母绿。随着二价、三价离子的进入,一价离子及水分子会进入祖母绿的结构通道中以维持结构整体的电荷平衡[1]。不同产地的祖母绿矿床类型不同,其含有的元素种类和含量也不尽相同。致色元素及碱金属离子含量会直接影响祖母绿的基本宝石学性质和光谱学特征,而微量元素的种类和含量与祖母绿形成时的地质条件和环境息息相关,是连接祖母绿各项性质与产地的桥梁,也是产地判别方法中最有效最可靠的判别依据。这种微量元素大多反映在碱金属元素上,因此可以利用碱金属元素对不同产地的祖母绿进行鉴别。

    祖母绿产地鉴别研究历史悠久,目前较为系统的是Sudarat Saeseaw等[2]在2019年提出的一种祖母绿溯源方法——结合紫外-可见光谱、包裹体及微量元素等特征鉴别不同成因祖母绿的产地。在此期间,许多专家学者[2-12]在研究某一产地祖母绿时,都会分析其微量元素上的区别,为祖母绿产地鉴别提供切实依据。

    然而,使用单一的微量元素并不能鉴别出不同产地的祖母绿,若使鉴别结果准确可靠,三种以上微量元素种类相结合是必不可少,这就意味往往需要多个投点图综合判断,不仅过程繁琐且范围精确度较低。随着计算机和多元统计方法的发展,数理模型被应用在更广泛的学科上。为了找寻更便捷的区分祖母绿产地的方法,在本文,笔者,选取了前人文献[7]中的9个产地祖母绿的元素数据,利用SPSS对这些元素数据进行分析和建模。使用相关分析做多重共线性诊断,因子分析做相关性辅助,聚类分析和判别分析做产地归类,对来自中国云南麻栗坡、巴基斯坦斯瓦特山谷、马达加斯加马南贾里、阿富汗潘杰希尔山谷、巴西伊塔贝拉、埃塞俄比亚沙基索、赞比亚卡夫布、津巴布韦桑德瓦纳和俄罗斯乌拉尔的9个产地的祖母绿进行产地溯源。

    本次分析所使用的元素数据一部分为笔者亲测,另一部分来自前人文献[13-14]。笔者共收集了来自巴基斯坦斯瓦特山谷的15颗祖母绿样品,共测试49个点位。测试仪器为激光剥蚀电感耦合等离子体质谱仪(LA-ICP-MS),由GeolasPro激光剥蚀系统和Agilent 7700电感耦合等离子体测试系统组成。准分子激光器为COMPexPro 102 ArF 193 nm,光学系统为MicroLas。剥蚀过程中采用氦气做载气、氩气为补偿气以调节灵敏度,剥蚀系统配置有信号平滑装置。本次分析的激光束斑和频率分别为44 μm和5 Hz。不使用内标,采用BHVO-2G、BCR-2G和BIR-1G多种标准物质对元素浓度进行校准。利用Al做归一化元素,用NIST 610玻璃做时间漂移校正。

    笔者还选择了9个产地(中国云南麻栗坡、巴基斯坦斯瓦特山谷、马达加斯加马南贾里、阿富汗潘杰希尔山谷、巴西伊塔贝拉、埃塞俄比亚沙基索、赞比亚卡夫布、津巴布韦桑德瓦纳和俄罗斯乌拉尔)的242组祖母绿样品相关数据进行分析。

    祖母绿的化学式为Be3Al2(SiO3)6,不同产地祖母母样品的结构和主要化学成分的种类及含量差异较小,但具有不同的成矿环境和成矿流体,导致祖母绿中所含的元素种类和含量不相同,可以此作为产地分析模型的数据输入。祖母绿结构通道中的碱金属离子与其成矿流体及类质同象替代有关,考虑将碱金属离子Li、Na、K、Rb、Cs的含量作为模型输入数据的一部分。同时结合前人文献研究,在数据统计中加入Sc和Ga的含量[5]。部分数据如表 1所示。

    Table  1.  Alkali metal content in emerald from different origins/10-6
    产地编号 Li Na K Sc Ga Rb Cs
    1 347 9 481 159 168 13 27 1 876
    1 343 8 749 284 160 13 25 2 117
    1 333 8 725 155 164 13 28 2 158
    1 285 6 003 122 82 14 20 1 990
    1 288 6 095 97 79 13 21 1 915
    1 342 7 375 125 71 14 22 2 103
    1 315 9 344 229 142 15 30 2 485
    1 308 9 180 196 152 14 32 2 405
    1 309 9 186 200 154 15 31 2 317
    1 302 7 236 146 113 15 26 1 976
    1 308 7 301 151 108 13 22 2 028
    1 300 7 585 161 104 14 28 1 841
    1 259 6 340 128 143 13 22 1 730
    1 264 6 173 128 132 13 23 1 731
    1 261 6 381 128 137 12 23 1 752
    2 259 14 226 190 1 165 4 6 381
    2 311 13 801 74 720 3 6 406
    2 231 19 091 297 256 6 27 1 141
    2 398 19 095 299 234 8 38 1 559
    2 392 18 982 258 236 8 38 1 570
    2 254 15 758 205 439 4 7 142
    2 235 17 092 163 82 2 6 87
    2 273 15 848 164 2 080 9 9 424
    2 281 16 387 145 2 743 8 11 281
    2 438 9 327 239 1 554 22 6 197
    2 459 17 821 166 199 8 18 828
    2 567 16 824 116 132 5 12 390
    2 501 16 513 155 153 6 12 455
    3 62 13 477 721 30 8 76 404
    3 64 14 078 743 30 8 79 414
    3 67 13 843 718 28 7 78 404
    3 87 13 457 3 002 30 8 402 1 167
    3 88 13 864 3 026 30 8 405 1 167
    3 91 13 863 3 128 58 7 402 1 166
    3 91 15 988 911 57 6 142 651
    3 94 17 723 1 081 61 6 154 634
    3 96 15 964 1 020 306 13 144 637
    3 109 14 945 1 082 288 12 48 224
    3 114 17 516 956 304 13 50 217
    3 115 16 069 1 071 22 8 47 226
    4 94 13 268 1 062 2 116 28 81 171
    4 94 10 761 940 2 177 28 72 163
    4 95 10 946 965 1 929 29 70 165
    4 97 8 326 544 1 943 27 44 111
    4 99 8 098 535 1 953 27 45 113
    4 100 8 384 542 198 14 43 112
    4 102 4 650 107 214 14 11 72
    4 106 4 937 118 212 15 12 70
    4 109 5 166 146 205 15 13 73
    4 188 - - 452 15 96 109
    5 49 9 365 188 110 13 26 97
    5 50 10 729 202 56 13 38 237
    5 50 10 727 169 113 7 27 104
    5 50 11 340 186 58 13 39 243
    5 50 12 534 224 50 12 25 97
    5 51 10 444 164 112 7 38 104
    5 51 10 435 210 151 14 27 249
    5 51 10 943 169 104 11 31 164
    5 66 7 845 261 50 9 29 191
    5 66 7 771 286 37 12 36 195
    5 - 8 432 250 49 - - 119
    6 409 14 587 415 60 21 59 547
    6 429 14 253 438 66 19 57 558
    6 435 14 496 421 133 17 63 567
    6 455 15 062 442 140 20 64 442
    6 503 12 888 344 139 19 51 457
    6 518 13 099 334 105 17 51 439
    6 525 12 643 338 117 17 50 430
    6 530 13 291 333 108 16 52 445
    7 617 16 727 485 24 14 74 1 238
    7 638 15 564 452 23 12 73 1 183
    7 687 17 127 422 20 13 73 1 077
    7 700 15 974 641 41 15 84 1 353
    7 722 15 758 653 43 15 86 1 361
    7 751 16 670 675 44 16 87 1 388
    7 830 16 072 711 25 13 57 1 430
    7 845 16 184 452 62 15 47 1 384
    7 888 15 872 698 28 14 73 1 342
    7 904 14 959 418 50 17 74 1 424
    7 908 14 870 430 50 17 41 1 453
    7 939 14 493 380 44 15 43 1 193
    7 955 15 170 382 46 16 42 1 255
    7 - 14 488 375 47 15 - 1 199
    8 642 15 504 239 25 32 216 435
    8 652 15 811 231 26 32 213 439
    8 661 16 310 234 26 31 216 457
    8 675 16 137 242 26 34 218 442
    8 700 16 133 227 19 26 216 449
    8 1 203 19 296 412 18 27 274 898
    8 1 217 19 264 412 19 25 272 904
    8 1 220 18 736 398 18 25 284 895
    8 1 257 19 328 405 18 25 271 897
    8 1 283 19 526 422 19 25 275 907
    8 1 293 19 023 411 17 27 287 906
    8 1 308 20 026 387 17 29 286 865
    8 1 386 20 236 430 18 27 292 898
    9 947 5 791 52 20 18 9 430
    9 952 5 529 89 37 13 8 471
    9 968 6 457 57 20 19 26 728
    9 971 8 778 103 20 18 11 448
    9 1 037 7 196 63 20 6 24 742
    9 1 056 7 325 67 64 12 25 746
    9 1 073 8 960 79 64 18 27 411
    9 1 078 9 145 102 19 7 10 466
    9 1 099 - - 23 7 10 487
    9 1 158 - - 67 13 16 513
    9 1 181 - - - - 16 546
    9 1 195 - - - - 16 494
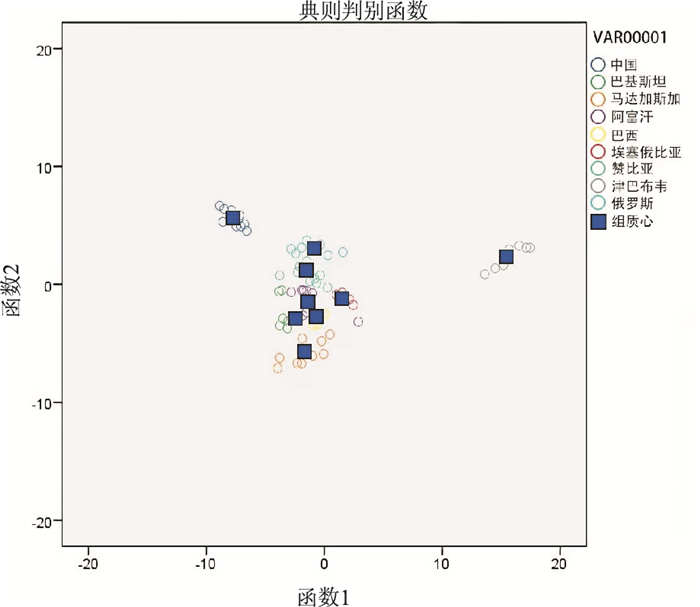
    注:产地编号1~9代表不同产地,1-中国云南麻栗坡,2-巴基斯坦斯瓦特山谷,3-马达加斯加马南贾里,4-阿富汗潘杰希尔山谷,5-巴西伊塔贝拉,6-埃塞俄比亚沙基索,7-赞比亚卡夫布,8-津巴布韦桑德瓦纳,9-俄罗斯乌拉尔山脉;2为自测的数据,1和3~9来自[2, 14]
     | Show Table
    DownLoad: CSV

    为了达到降维的目的,减少因变量太多造成的信息重复性和模型复杂性,对所获得的7组元素数据进行因子分析,观察能否通过因子分析在数据信息丢失最少的情况下减少变量的个数,消除变量的相关性以便后续更好的开展判别和聚类分析,得出表 2[15-16]

    Table  2.  KMO and Bartlett test
    KMO取样适切性量数 0.393
    巴特利特球形度检验 近似卡方 423.063
    自由度 21.000
    显著性 0
     | Show Table
    DownLoad: CSV

    从KMO和巴特利特检验表中可以看出,KMO值为0.393,小于0.6,表明变量间相关性低。线性回归分析预估数据的多重共线性,结果可与因子分析的结果相互印证。

    表 3可得,所有变量VIF值均小于5,表明此之间不存在严格的多重共线性,可作为判别模型的输入数据。

    Table  3.  Coefficient
    模型 未标准化系数 标准化系数 t 显著性 共线性统计
    B 标准误差 Beta 容差 VIF
    1 (常量) 3.196 0.384 8.325 0
    Li 0.004 0 0.523 11.263 0 0.542 1.845
    Na -3.41×10⁻⁵ 0 -0.064 -1.422 0.156 0.574 1.742
    K 0 0 0.052 1.030 0.304 0.455 2.199
    Sc -0.002 0 -0.349 -9.040 0 0.786 1.272
    Ga 0.133 0.017 0.371 8.058 0 0.552 1.811
    Rb -0.001 0.002 -0.028 -0.466 0.642 0.323 3.096
    Cs -0.002 0 -0.513 -14.016 0 0.873 1.145
    a.因变量:V1
     | Show Table
    DownLoad: CSV

    以Li、Na、K、Ga、Sc、Rb和Cs这7组数据作贝叶斯判别分析,结果如下所示。

    表 4显示所有变量均通过显著性水平为0.05的检验,表明所有变量对建立判别函数的贡献均显著,因此变量对模型的解释程度较高。

    Table  4.  Equivalence test of mean value
    元素 威尔克
    Lambda
    F 自由度1 自由度2 显著性
    Li 0.108 227.900 8 221 0
    Na 0.180 126.231 8 221 0
    K 0.475 30.519 8 221 0
    Sc 0.613 17.458 8 221 0
    Ga 0.218 98.821 8 221 0
    Rb 0.262 77.968 8 221 0
    Cs 0.191 117.053 8 221 0
     | Show Table
    DownLoad: CSV

    表 56显示函数1到7均通过显著性水平α为0.05的显著性检验,因此4个典型判别函数对于探寻自变量元素与因变量产地之间关系的作用均显著。

    Table  5.  Eigenvalue
    函数 特征值 方差百分比 累计百分比 典型相关性
    1 14.126a 41.8 41.8 0.966
    2 10.603a 31.4 73.2 0.956
    3 5.830a 17.3 90.5 0.924
    4 1.613a 4.8 95.2 0.786
    5 0.772a 2.3 97.5 0.660
    6 0.565a 1.7 99.2 0.601
    7 0.274a 0.8 100.0 0.464
    a.在分析中使用了前7个典则判别函数
     | Show Table
    DownLoad: CSV
    Table  6.  Wilk Lambda
    函数检验 威尔克
    Lambda
    卡方 自由度 显著性
    1直至7 0 2 057.764 56 0
    2直至7 0.001 1 457.443 42 0
    3直至7 0.016 915.713 30 0
    4直至7 0.108 491.101 20 0
    5直至7 0.283 278.846 12 0
    6直至7 0.502 152.450 6 0
    7 0.785 53.464 2 0
     | Show Table
    DownLoad: CSV

    表 7显示了自变量碱金属离子含量与因变量产地之间的关系函数,通过表 5表 6可知,前两个判别函数的相关性相对较高,因此判别产地时使用前两个判别函数进行预判。把自变量的数据带入函数1和2,选择距离较近的因变量作为判别的结果。

    Table  7.  Canonical discriminant function coefficient
    函数
    1 2 3 4 5 6 7
    Li 0.006 0.005 0.003 -0.003 0.004 -0.001 0.000
    Na 0.000 0.000 0.000 0.000 0.000 0.000 0.000
    K -0.002 0.001 0.000 0.000 0.003 0.003 0.000
    Sc -0.001 0.001 0.001 0.000 0.000 -0.001 0.002
    Ga 0.252 -0.056 -0.204 -0.014 -0.109 0.212 0.017
    Rb 0.018 -0.019 -0.006 0.014 -0.003 -0.024 0.006
    Cs -0.001 0.004 0.000 0.002 -0.001 0.000 0.000
    (常量) -6.744 0.699 -3.523 -2.057 1.865 -4.934 0.049
    未标准化系数
     | Show Table
    DownLoad: CSV

    表 8是根据给出的数据利用判别函数1和2计算出的每个产地组质心的函数值,图 1为可视化函数图。由上图可看出,横坐标为典型判别函数1,纵坐标为典型判别函数2,利用此两种典型判别函数算出各个样品值的坐标。图 1中9个方框表示每个产地样品的组质心,得出坐标之后根据坐标离中心的远近判断待判样品的产地归属。不同颜色的圆圈代表不同产地,相同颜色的圆圈有一定的聚类效果,但有些点位重叠,从总体上看,此图对产地有很好的区分度。

    Table  8.  Functions at the centroid of the group
    V1 函数
    1 2 3 4 5 6 7
    Malipo, China -1.817 7.117 -2.415 1.544 -0.588 -0.247 0.160
    Swat, Pakistan -1.802 0.146 3.987 -0.266 -0.459 -0.225 0.215
    Mananjary, Madagascar -1.537 -3.491 0.158 2.322 1.510 -0.084 -0.038
    Panjsher, Afghanistan -1.244 -1.641 -2.378 -1.008 0.216 0.771 1.108
    Itabira, Brazil -2.004 -2.045 -1.811 -0.648 -0.388 -0.473 -0.527
    Shakisso, Ethlopia 2.573 -1.016 -0.486 -0.416 -0.671 1.563 -0.510
    Kafubu, Zambia 3.585 3.799 1.729 -0.065 0.946 1.151 -0.597
    Sandawarna, Zimbabwe 12.802 -2.437 -0.432 0.985 -0.870 -0.949 0.392
    Ural, Russia 3.750 5.003 -0.577 -3.506 2.570 -1.426 -0.002
    按组平均值进行求值的未标准化典则判别函数
     | Show Table
    DownLoad: CSV
    Figure  1.  Typical discriminant function diagram

    表 9中判别结果: a. 正确地对95.9% 个原始已分组个案进行了分类;b. 仅针对分析中的个案进行交叉验证。在交叉验证中,每个个案都由那些从该个案以外的所有个案派生的函数进行分类;c. 正确地对91.7% 个进行了交叉验证的已分组个案进行了分类。从判别分析结果来看,利用数理模型中的判别分析方法对不同产地祖母绿进行产地溯源的正确率达90%,因此利用此方法对不同产地宝石进行产地溯源是具有可行性的。

    Table  9.  Prediction group member information
    V1 中国 巴基斯坦 马达加斯加 阿富汗 巴西 埃塞俄比亚 赞比亚 津巴布韦 俄罗斯 总计
    原始 计数 中国 24 0 0 0 0 0 0 0 0 24
    巴基斯坦 0 48 0 1 0 0 0 0 0 49
    马达加斯加 0 2 23 0 1 0 0 0 0 26
    阿富汗 0 0 1 21 4 0 0 0 0 26
    巴西 0 0 0 0 53 0 0 0 0 53
    埃塞俄比亚 0 0 0 0 0 18 0 0 0 18
    赞比亚 0 0 0 0 0 1 17 0 0 18
    津巴布韦 0 0 0 0 0 0 0 13 0 13
    俄罗斯 0 0 0 0 0 0 0 0 15 15
    % 中国 100 0 0 0 0 0 0 0 0 100
    巴基斯坦 0 98 0 2 0 0 0 0 0 100
    马达加斯加 0 7.7 88.5 0 3.8 0 0 0 0 100
    阿富汗 0 0 3.8 80.8 15.4 0 0 0 0 100
    巴西 0 0 0 0 100 0 0 0 0 100
    埃塞俄比亚 0 0 0 0 0 100 0 0 0 100
    赞比亚 0 0 0 0 0 5.6 94.4 0 0 100
    津巴布韦 0 0 0 0 0 0 0 100 0 100
    俄罗斯 0 0 0 0 0 0 0 0 100 100
    交叉验证 计数 中国 24 0 0 0 0 0 0 0 0 24
    巴基斯坦 0 47 0 2 0 0 0 0 0 49
    马达加斯加 0 2 21 1 2 0 0 0 0 26
    阿富汗 0 0 3 16 7 0 0 0 0 26
    巴西 0 0 0 0 53 0 0 0 0 53
    埃塞俄比亚 0 0 0 0 0 18 0 0 0 18
    赞比亚 0 0 0 0 0 1 17 0 0 18
    津巴布韦 0 0 0 0 0 0 0 13 0 13
    俄罗斯 0 0 0 0 0 0 2 0 13 15
    % 中国 100 0 0 0 0 0 0 0 0 100
    巴基斯坦 0 95.9 0 4.1 0 0 0 0 0 100
    马达加斯加 0 7.7 80.8 3.8 7.7 0 0 0 0 100
    阿富汗 0 0 11.5 61.5 26.9 0 0 0 0 100
    巴西 0 0 0 0 100 0 0 0 0 100
    埃塞俄比亚 0 0 0 0 0 100 0 0 0 100
    赞比亚 0 0 0 0 0 5.6 94.4 0 0 100
    津巴布韦 0 0 0 0 0 0 0 100 0 100
    俄罗斯 0 0 0 0 0 0 13.3 0 86.7 100
     | Show Table
    DownLoad: CSV

    祖母绿作为绿色宝石之王在五大洲均有发现,目前市场上占据主流的产地有哥伦比亚、巴西、赞比亚、俄罗斯、津巴布韦、马达加斯加和巴基斯坦等地。其中排名前几的为哥伦比亚、巴西和赞比亚。Gaston Giuliani和Lee A. Groat经过研究按照地质环境分成两种类型,第一类为构造-岩浆有关,第二类与构造-变质作用有关,由于地质作用的不同,祖母绿中所含的元素种类和含量也不同,可以利用此进行产地判别分析。

    利用SPSS对来自9个产地的242组祖母绿样品数据进行产地判别,从因子分析看出,KMO值小于0.6,表明作为变量的7组元素含量之间没有相关性,同时利用线性回归的多重共线性诊断发现变量无明显的多重共线性。因此得出以下结论:判别分析可达到91.2%的较高正确率,证明利用数理模型中的判别模型,以不同产地宝石中的元素作为变量进行产地溯源是具有很大潜力的。

    但是仍然有一些问题:(1)样品数据不够大,此结果不能作一般性解释;(2)在祖母绿的众多产地中只选取了9个产地,若加入其它产地的数据,所得结果的正确率可能会降低;(3)只选取了七种元素,具有一定的信息限制。(4)有些产地的祖母绿有缺失值,使用此产地的平均值代替缺失值,具有一定误差。

  • [1]
    Giuliani G, Groat L A, Marshall D, et al. Emerald deposits: A review and enhanced classification[J]. Minerals, 2019, 9(2): 105-168. doi: 10.3390/min9020105
    [2]
    Palke A C, Saeseaw S, Renfro N D, et al. Geographic origin determination of emerald[J]. Gems & Gemology, 2019, 55(4): 614-646.
    [3]
    Sun Z Y, Palke A C, Muyal J, et al. Geographic origin determination of alexandrite[J]. Gems & Gemology, 2019, 55(4): 660-681.
    [4]
    Groat L A, Giuliani G, Stone-Sundberg J, et al. A review of analytical methods used in geographic origin determination of gemstones[J]. Gems & Gemology, 2019, 55(4): 512-535.
    [5]
    Guo H S, Yu X Y, Zheng Y Y, et al. Inclusions and trace element characteristics of emeralds from Swat Valley, Pakistan[J]. Gems & Gemology, 2021, 56(3): 336-355.
    [6]
    Krzemnicki M S. New emeralds from Musakashi, Zambia, appear on the market[J]. The Journal of Gemmology, 2021, 37(5): 771-769.
    [7]
    Schmetzer K. History of emerald mining in the Habachtal deposit of Austria, Part I[J]. Gems & Gemology, 2022, 57(4): 338-371.
    [8]
    Henneebois U, Karampelas S, Delaunay A. Caractéristiques des émraudes de Musakashi, Zambie[J]. Revue de Gemmologie A.F.G., 2022(216): 15-17.
    [9]
    Krezemnicki M S, Wang H A O, Buche S. A new type of emerald from Afghanistan's Panjshir Valley[J]. The Journal of Gemmology, 2021, 37(5): 474-495. doi: 10.15506/JoG.2021.37.5.474
    [10]
    Cui D, Liao Z T, Qi L J, et al. A study of emeralds from Davdar, north-western China[J]. The Journal of Gemmology, 2020, 37(4): 374-392. doi: 10.15506/JoG.2020.37.4.374
    [11]
    Giuliani G, Groat L A. Geology of corundum and emerald gem deposits: A review[J]. Gems & Gemology, 2019, 55(4): 464-489.
    [12]
    Palke A C, Saeseaw S, Renfro N D, et al. Geographic origin determination of blue sapphire[J]. Gems & Gemology, 2019, 55(4): 536-579.
    [13]
    Saeseaw S, Pardieu V, Sangsawong S. Three-phase inclusions in emerald and their impact on origin determination[J]. Gems & Gemology, 2014, 50(2): 114-132.
    [14]
    Karampelas S, Al-Shaybani B, Mohamed F, et al. Emeralds from the most important occurrences: Chemical and spectroscopic data[J]. Minerals, 2019, 9(9): 561. doi: 10.3390/min9090561
    [15]
    夏怡凡. SPSS统计分析精要与实例详解[M]. 北京: 电子工业出版社, 2010.

    Xia Y F. Essentials and example explanation of SPSS statistical analysis[M]. Beijing: Publishing House of Electronics Industry, 2010. (in Chinese)
    [16]
    向东进, 李宏伟, 刘小雅. 实用多元统计分析[M]. 武汉: 中国地质大学出版社, 2005.

    Xiang D J, Li H W, Liu X Y. Practical multivariate statistical analysis[M]. Wuhan: China University of Geosciences Press, 2015. (in Chinese)

Catalog

    Figures(1)  /  Tables(9)

    Article Metrics

    Article views (136) PDF downloads (58) Cited by()
    Related

    /

    DownLoad:  Full-Size Img  PowerPoint
    Return
    Return