QU Zhi, LI Peng, LIU Ping, SHEN Hongtao. Gemmological and Spectroscopic Characteristics of Natural and Synthetic Fluorites[J]. Journal of Gems & Gemmology, 2025, 27(2): 52-61. DOI: 10.15964/j.cnki.027jgg.2025.02.007
Citation: QU Zhi, LI Peng, LIU Ping, SHEN Hongtao. Gemmological and Spectroscopic Characteristics of Natural and Synthetic Fluorites[J]. Journal of Gems & Gemmology, 2025, 27(2): 52-61. DOI: 10.15964/j.cnki.027jgg.2025.02.007

Gemmological and Spectroscopic Characteristics of Natural and Synthetic Fluorites

More Information
  • Received Date: October 20, 2024
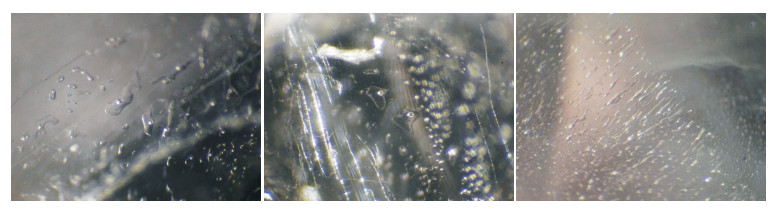
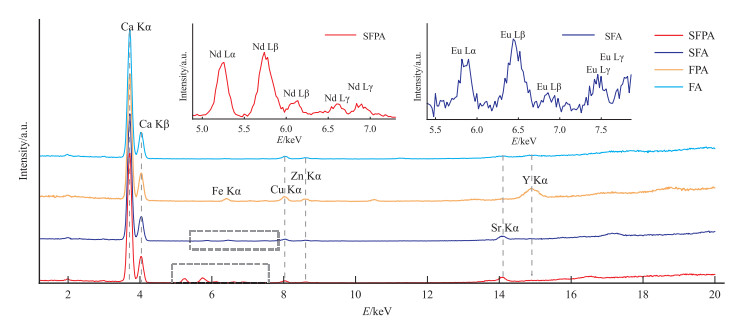
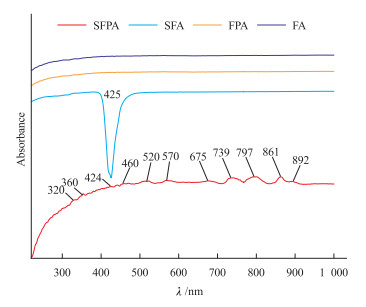
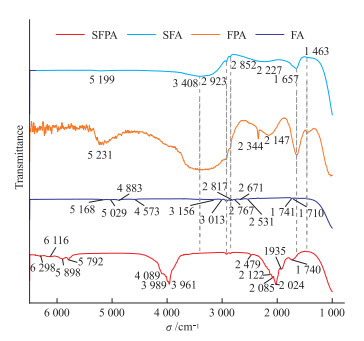
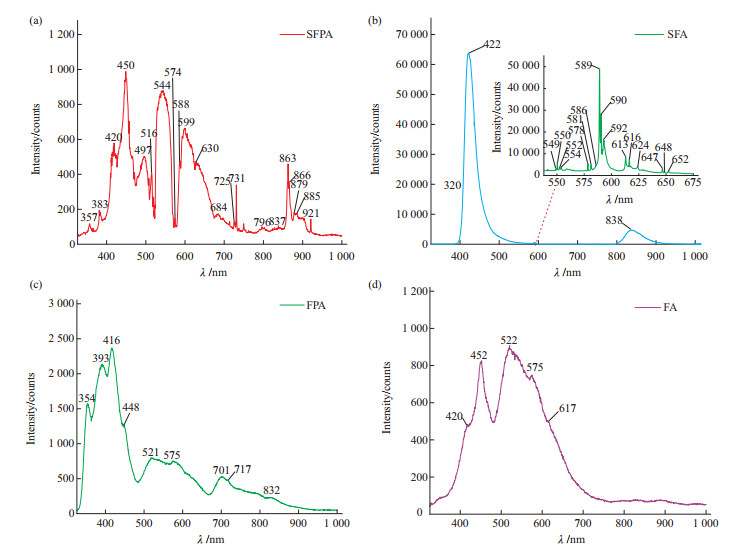
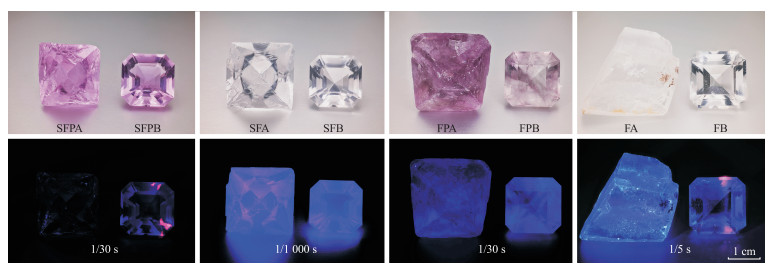
  • Fluorite is not only an important industrial mineral, but also a major species in the jewelry and mineral collection market. In recent years, with the diversification of demand in the gemstone jewelry market, fluorite has been widely used to make faceted gemstones, beads, bracelets, and other forms of jewelry. Fluorite is a common and easy to be synthesized material. Synthetic fluorite sometimes appears in the mineral collections and gem markets. Based on the identification demand of natural and synthetic fluorite, through microscopic observation, femtosecond laser ablation plasma mass spectrometer (fs-LA-ICP-MS), X-ray fluorescence spectrometer (XRF), ultraviolet-visible absorption spectrometer (UV-Vis), infrared spectrometer (FTIR), and photoluminescence spectrometer (PL), inclusion, optical properties, chemical compositions, and spectroscopy characteristics of natural fluorite and synthetic fluorite samples were obtained. Microscopic observation shows that there are no obvious inclusions in synthetic fluorite samples, while natural fluorite samples contain a large amount of gas-liquid inclusions. By fs-LA-ICP-MS, the Nd and Eu contents in synthetic violet fluorite and colourless fluorite samples reach 775.13×10⁻⁶-832.63×10⁻⁶ and 15 173.88×10⁻⁶-16 674.97×10⁻⁶, respectively, significantly higher than those in natural fluorite samples, such amount of Nd and Eu can be detected by XRF and makes it easy for identification. In UV-Vis spectra, synthetic fluorite samples shows obvious absorption and fluorescence peaks caused by doped REE, while natural fluorite samples show nothing obvious in their spectra. FTIR shows a large number of vibration peaks related to CO32-, CO2, hydroxyl groups, and water in natural fluorite samples, while synthetic fluorite samples do not, which is a useful character to distinguish whether fluorite is natural or not. The PL spectrum indicates that synthetic fluorite has a higher content of various REE than that in natural fluorite, and multiple REE in different valence states produce different fluorescence peaks, resulting in a more complex PL spectrum than that in natural fluorite. Moreover, the Eu2+ transition peak intensity of synthetic colorless fluorite samples doped with a large amount of Eu is significantly higher than that of natural fluorite, which can be used to assist in the identification of fluorite's naturalness.

  • 萤石是一种自然界中广泛分布的矿物,化学式为CaF2,等轴晶系,工业上是氟化工体系中最重要的上游原料之一[1]。其颜色丰富,如紫色、绿色、蓝色、黄色、粉红色和无色等, 形态各异且部分萤石具有一些特殊光学性质,如荧光、磷光或变色效应,广受矿物晶体和宝石首饰消费市场的青睐。萤石的摩氏硬度为4,具有完全解理。市面上以雕件、球形及珠串为主,较少切割为刻面宝石。近年来,由于刻面宝石的切磨技术提高,市场上出现了大量彩色刻面萤石。

    对于合成萤石的研究多集中于晶体生长工艺及激光材料方向,国内外尚未有学者对合成萤石进行系统性的宝石学测试。本文选取市场上新出现的无色及紫色的变色合成萤石为研究对象,进行常规的宝石学测试,并开展飞秒激光剥蚀电感耦合等离子体质谱(fs-LA-ICP-MS)、X射线荧光光谱(XRF)、紫外-可见吸收光谱(UV-Vis)、红外光谱(FTIR)和光致发光光谱(PL)分析,同时与相近颜色的天然萤石样品进行对比,为合成萤石的鉴定提供理论支持。

    笔者在日本国际珠宝展购买了一些合成萤石的原石样品及刻面样品: 一种为无色透明、具有强荧光效应的萤石;另一种为紫色、透明、具有变色效应的萤石。合成萤石样品来自日本佳能公司,该公司于2014年开发出人工合成萤石技术。

    测试样品分为4组:第一组为具有变色效应的粉紫色八面体解理块的合成萤石原石样品SFPA和粉紫色刻面合成萤石样品SFPB;第二组为无色八面体解理块合成萤石样品SFA和无色刻面合成萤石样品SFB;第三组为紫色八面体解理块天然萤石样品FPA和紫色刻面天然萤石样品FPB;第四组为无色解理块天然萤石样品FA和无色刻面天然萤石样品FB。

    各萤石样品在自然光下特征及长波紫外线下的荧光效应如图 1所示,照片采用统一比例尺,不同萤石样品的紫外荧光照片拍摄使用的曝光时间如图 1中所示。紫外荧光照片中的紫红色部分为CMOS对紫外线的频谱响应导致[2],并非萤石自身的荧光。除样品SFA及SFB外,其余样品的紫外荧光均较弱。

    Figure  1.  Fluorite samples and their fluorescence characteristics under long wave (365 nm) ultraviolet light

    常规宝石学测试于青岛市计量技术研究院黄金珠宝检验站实验室完成,采用宝石折射率仪、长短波紫外灯和宝石显微镜分别对样品的折射率、紫外荧光特征和内部特征进行观测。

    飞秒激光剥蚀电感耦合等离子体质谱(fs-LA-ICP-MS)测试在中国科学院广州地球化学研究所完成, 仪器为美国Applied Spectra公司J200 Tandem QX 343 nm飞秒激光剥蚀进样系统,电感耦合等离子体质谱仪为Thermo Scientific iCap-RQ四极杆型电感耦合等离子体质谱仪(ICP-MS)。实验过程中采用He为载气,Ar为辅助气,单点分析时间为105 s,其中20 s的空白背景采集,45 s连续剥蚀采集,40 s清洗进样系统;线扫描分析时间为120 s,空白背景采集时间为20 s,连续剥蚀采集时间为55 s,清洗进样系统时间为50 s。使用线扫描(束斑40 μm,长度60 μm)剥蚀方式,能量密度1 J/cm2,频率6 Hz。NIST610作为外标,Ca作为内标元素计算微量元素含量。实验过程中采用的标准物质为BCR-2G、NIST SRM 610、NIST SRM 612、BHVO-2G。数据结果采用内标法用ICPMSDataCal12.2进行处理,对于萤石,选用Ca元素含量51.33 wt % 作为内标。各测试样品制靶后,分别随机选择10个点位进行测试。

    X射线荧光光谱使用Skyray EDX3000Plus光谱仪采集,测试于青岛市计量技术研究院黄金珠宝饰品检验站完成。测试条件:准直器直径5 mm,测试范围0~40 keV,测量时间300 s,采用Ag的工作曲线。

    紫外-可见光谱使用Skyray GEM-UV 100紫外-可见光谱仪测量,在中国地质大学(武汉)珠宝学院完成。测试采用反射法, 积分时间110 ms,测试5次,范围为220~1 000 nm。

    红外光谱使用布鲁克TENSOR-27型傅里叶变换红外光谱仪,测试于青岛市计量技术研究院黄金珠宝饰品检验站。样品分别测试采用透射法,扫描范围6 500~400 cm-1,分辨率4 cm-1,扫描次数32次。

    光致发光光谱采用Horiba公司的LabRAM HR Evolution激光拉曼光谱仪测得,在中国地质大学(武汉)地质过程与矿产资源国家重点实验室完成,测试条件:激发光波长325 nm/532 nm,常温常压,物镜倍率15倍,积分时间2~20 s,积分次数2次,光栅选择600 gr/mm,光圈孔径为150,功率衰减片100%,测试范围326~1 000 nm。

    刻面萤石样品的常规宝石学特征如表 1所示。结果显示,样品的折射率为1.431~1.434;静水称重法测得其相对密度3.20~3.23;在长波(365 nm)及短波(255 nm)紫外荧光灯照射下,合成无色萤石样品SFB发出强蓝白色荧光,其他样品荧光均不明显;宝石显微镜下观察,合成萤石样品SFB与SFPB内部干净,未见明显包裹体,天然萤石样品FB与FPB可见大量的气液两相包裹体,如图 2所示。本文萤石样品的折射率、相对密度均在文献给出的范围内。

    Table  1.  Conventional gemmological characteristics of natural and synthetic fluorite samples
    样品编号 颜色 重量/ct 折射率 相对密度 长波紫外光下荧光 短波紫外光下荧光 消光现象
    SFPB 紫色 12.20 1.434 3.23 弱蓝紫色 全暗
    SFB 无色 12.11 1.432 3.20 强蓝白色 强蓝白色 全暗
    FPB 紫色 17.35 1.432 3.22 弱蓝紫色 异常消光
    FB 无色 15.72 1.431 3.22 弱白色 异常消光
     | Show Table
    DownLoad: CSV
    Figure  2.  A large number of gas-liquid inclusions in natural fluorite samples FPB and FB

    在偏光镜下旋转360°,合成萤石样品SFB与SFPB呈现全暗,无明显明暗交替,显示为均质体。天然萤石样品FB与FPB偏光镜下旋转360°,边角处呈现明暗交替的异常消光现象。

    常规宝石学参数中, 天然萤石和合成萤石样品的折射率和相对密度相近,无明显规律,偏光镜下明暗交替现象并不明显,因此也无法有效地区分。合成无色萤石样品SFB在全波段紫外灯下呈现强蓝白色荧光,目前天然萤石中尚未有观测到相似强度的荧光,具有一定的鉴定意义。

    萤石、方解石等透明矿物因能量吸收率相对较低,在使用普通LA-ICP-MS系统进行分析时,易因样品能量吸收不足而剥蚀效果不佳,难以定量分析甚至获取有效数据。因此,对萤石中的微量元素进行测试分析时有必要使用fs-LA-ICP-MS系统[3]

    天然萤石和合成萤石样品的fs-LA-ICP-MS测试结果如表 2所示。结果显示,不同萤石样品中微量元素的含量有一定的差异,这些元素大致可以分为四类:碱金属元素,碱土金属元素,稀土元素和其它元素。

    Table  2.  Contents of trace elements of synthetic fluorite samples and natural fluorite samples ×10-6
    样品编号 Na Mg Al Si K Ga Ge As Sr La Ce Pr Nd Sm Eu
    SFA-1 413.79 61.72 17.48 1 571.08 16.15 - - - 107.68 3.86 6.67 0.83 4.08 0.93 829.39
    SFA-2 106.74 27.93 5.77 1 229.87 - 0.01 - 0.71 105.58 3.77 6.61 0.78 3.98 0.90 799.84
    SFA-3 72.36 33.53 6.62 1 132.80 0.99 0.07 0.69 - 101.78 3.69 6.08 0.79 4.02 0.94 818.13
    SFA-4 53.49 20.84 9.69 1 222.98 - - 0.01 - 105.97 3.71 6.47 0.80 3.84 0.93 832.63
    SFA-5 67.79 14.29 4.48 1 104.69 - 0.04 0.05 0.47 99.91 3.48 6.17 0.78 3.79 0.97 831.88
    SFA-6 470.29 110.29 33.58 2 812.78 9.96 0.03 - 0.38 100.41 3.51 5.92 0.75 3.79 0.93 800.87
    SFA-7 476.05 109.16 33.54 2 195.70 21.49 - 0.76 - 95.43 3.50 6.16 0.73 3.73 1.05 794.68
    SFA-8 322.23 83.07 26.75 1 856.62 13.23 - 0.10 - 94.58 3.31 5.83 0.76 3.72 1.05 797.28
    SFA-9 440.17 110.77 30.65 2 379.68 12.94 0.05 - 0.65 102.26 3.50 5.95 0.78 3.59 1.03 775.13
    SFA-10 762.84 186.29 48.09 3 264.27 16.46 0.04 - - 97.18 3.59 6.10 0.77 3.80 0.92 784.13
    SFPA-1 - 4.19 0.90 895.46 - 48.99 113.45 75.78 133.30 7.56 13.69 2.49 15 461.72 1.21 0.41
    SFPA-2 - 3.84 - 781.46 - 49.71 114.32 71.71 135.73 7.16 13.32 2.61 16 221.28 1.13 0.31
    SFPA-3 8.67 2.32 - 401.44 - 47.57 106.81 74.14 133.09 6.80 13.14 2.55 15 173.88 1.11 2.19
    SFPA-4 - 3.66 0.10 564.06 - 48.94 113.72 76.00 134.08 6.79 13.06 2.49 15 703.65 1.16 0.31
    SFPA-5 - 3.02 - 229.56 - 46.58 113.61 75.06 132.12 7.21 13.79 2.48 15 756.14 1.03 0.36
    SFPA-6 21.30 3.10 0.06 892.70 9.84 47.93 103.53 66.58 130.00 7.14 13.46 2.42 16 526.04 1.14 0.33
    SFPA-7 - 1.54 - 527.29 - 48.53 103.77 72.44 128.96 7.36 13.53 2.51 16 211.71 1.26 0.30
    SFPA-8 20.34 3.07 - 456.11 - 48.35 108.17 69.92 127.80 7.07 13.34 2.59 16 438.53 1.06 0.31
    SFPA-9 - 2.69 1.67 392.68 - 49.98 115.50 72.08 131.80 7.11 13.42 2.57 16 674.97 1.31 0.28
    SFPA-10 - 3.02 - 327.00 - 49.39 106.73 72.77 127.03 6.70 12.67 2.57 15 405.02 1.14 0.31
    FA-1 321.54 0.62 3.90 465.82 9.35 0.06 - 0.64 7.83 0.02 0.01 - 0.01 0.01 -
    FA-2 - 2.29 - 387.39 2.57 - - 1.52 8.49 0.21 0.12 0.03 0.22 0.10 0.03
    FA-3 22.66 - 4.30 266.35 5.55 0.02 - 0.13 7.91 0.11 0.08 0.02 0.16 0.07 0.02
    FA-4 37.54 3.05 - 923.25 - 0.07 0.62 0.33 8.18 0.06 0.03 0.01 0.10 0.08 0.01
    FA-5 116.05 1.04 - 7.94 25.04 - - - 7.94 0.01 - - 0.01 0.01 -
    FA-6 108.38 - - - 28.84 0.06 1.16 0.09 8.08 0.25 0.19 0.04 0.35 0.14 0.05
    FA-7 27.59 3.92 0.82 - - - 0.11 - 9.41 0.02 0.02 - 0.02 0.03 0.01
    FA-8 - - - 1 905.02 0.66 - - - 8.63 0.03 0.03 0.01 0.07 0.04 0.01
    FA-9 - 0.62 2.33 - 8.79 0.07 - 0.37 7.94 0.15 0.11 0.03 0.19 0.12 0.04
    FA-10 - 3.15 2.25 - 5.62 - 0.24 0.92 8.75 0.17 0.14 0.03 0.19 0.10 0.05
    FPA-1 - - - 1 013.90 0.70 0.07 0.18 0.09 80.82 2.36 3.97 0.46 1.67 0.44 0.08
    FPA-2 - 1.17 - 361.72 - 0.04 0.17 0.69 87.71 1.34 2.27 0.23 1.04 0.23 0.06
    FPA-3 - 1.16 0.55 876.27 - - 1.03 - 86.43 2.07 3.65 0.43 1.69 0.47 0.14
    FPA-4 10.20 - 0.38 253.75 - - 0.81 - 88.89 2.45 4.09 0.48 2.00 0.44 0.10
    FPA-5 63.69 7.16 - - - - - 0.82 87.92 5.06 8.42 1.01 3.72 0.81 0.19
    FPA-6 - - 3.38 - 1.03 - 0.36 - 72.77 2.30 3.74 0.40 1.57 0.36 0.09
    FPA-7 - 1.75 - - 4.01 - 0.77 1.40 93.52 0.33 0.72 0.13 0.63 0.53 0.23
    FPA-8 66.18 5.48 0.83 526.72 11.89 0.12 1.04 - 64.70 5.29 8.52 0.96 3.68 0.66 0.13
    FPA-9 - 0.80 - 1 073.19 - 0.15 0.22 0.95 75.65 1.68 2.70 0.30 1.28 0.28 0.05
    FPA-10 36.65 3.58 2.85 - 4.42 0.03 - 0.01 78.07 3.06 5.02 0.58 2.13 0.43 0.08
    注:“-”表示低于检测限
     | Show Table
    DownLoad: CSV

    (1) 对于碱金属元素,合成无色萤石样品SFA的Na质量分数为53.49×10⁻⁶~762.84×10⁻⁶,高于天然无色萤石样品FA的0~321.54×10⁻⁶,并远高于合成紫色萤石样品SFPA的0~21.30×10⁻⁶和天然紫色萤石FPA的0~66.18×10⁻⁶;不同样品K的质量分数则无显著差异。

    (2) 对于碱土金属元素,合成无色萤石样品SFA的Mg质量分数为14.29×10⁻⁶~184.29×10⁻⁶,远高于合成紫色萤石样品SFPA、天然无色萤石样品FA及天然紫色萤石样品FPA的0~7.16×10⁻⁶;合成无色萤石样品SFA的Sr质量分数为97.18×10⁻⁶~107.68×10⁻⁶,低于合成紫色萤石样品SFPA的127.03× 10⁻⁶~135.73×10⁻⁶,但均高于天然紫色萤石样品FPA的64.70×10⁻⁶~93.52×10⁻⁶,且远高于天然无色萤石样品FA的7.83×10⁻⁶~9.41×10⁻⁶

    (3) 对于稀土元素,合成萤石样品SFPA中各稀土元素的质量分数均显著高于天然萤石的含量,其中合成无色萤石样品SFA中Eu质量分数高(775.13×10⁻⁶~832.63×10⁻⁶),其它样品中Eu的质量分数均低于2.19×10⁻⁶;合成紫色萤石样品SFPA中Nd的质量分数则高达15 173.88×10⁻⁶~16 674.97×10⁻⁶,其它样品中Nd的质量分数均低于4.08×10⁻⁶。由此可见,合成萤石样品均具有较高的REE水平,合成无色萤石样品SFA中Na、Mg、Sr、Al、Si、Eu的质量分数及合成紫色萤石样品SFPA中Sr、Ga、Ge、As、Nd的质量分数较天然萤石偏高,且Eu和Nd分别为合成无色萤石样品SFA及合成紫色萤石样品SFPA的主要掺杂元素,质量分数异常偏高。

    (4) 其它元素中,合成无色萤石样品SFA中Si的质量分数较高,达1 104.69×10⁻⁶~3 264.27×10⁻⁶,而合成紫色萤石样品SFPA与天然萤石样品的质量分数相当,均为0~1 905.02×10⁻⁶。剥蚀积分曲线显示Si为包裹体形式,这可能表示无色萤石的合成过程中引入了SiO2杂质。天然无色萤石样品FA及天然紫色萤石样品FPA中Al、Ga、Ge和As质量分数均极低,分别为0~4.30×10⁻⁶, 0~0.15×10⁻⁶, 0~1.16×10⁻⁶和0~1.52×10⁻⁶;而合成萤石中这些元素的质量分数普遍偏高,合成无色萤石样品SFA中Al的质量分数为4.48×10⁻⁶~48.09×10⁻⁶,Ga、Ge和As的质量分数则与天然萤石相当;合成紫色萤石样品SFPA中Al的质量分数为0~1.67×10⁻⁶,与天然萤石相当,而Ga、Ge和As的质量分数则分别为46.58×10⁻⁶~49.98×10-6,103.53×10-6~115.50×10⁻⁶和66.58×10⁻⁶~76.00×10⁻⁶

    综上,相对于天然萤石,合成无色萤石样品中Na、Mg、Sr、Al、Si的质量分数较高,且Eu的质量分数异常偏高;合成紫色萤石样品中Sr的质量分数较高,Ga、Ge、As和Nd的质量分数异常偏高。这些元素的质量分数特征为判断萤石是否为合成品提供了判断依据。

    不同萤石样品的XRF图谱如图 3所示,其中CuKα与ZnKα峰均为来自仪器自身的背景干扰峰。由于非真空式XRF探测范围有限,仅检出原子序数≥S的大部分元素,且不同元素的探测限差异较大。结果显示,合成萤石样品SFPA中掺杂的Nd和样品SFA中掺杂的Eu的质量分数已足以使用XRF进行探测,而天然萤石样品中REE仅Y可被观察到。同时,合成萤石样品中Sr的质量分数较天然萤石样品的更高,而考虑到CaF2-SrF2固溶体的存在,低含量的Sr元素无法成为萤石天然与否的判断依据。

    Figure  3.  XRF spectra of fluorite samples

    萤石样品的紫外-可见吸收光谱如图 4所示。结果显示,天然萤石样品FPA和FA在220~1 000 nm范围内的吸收率均高于85%,未观察到明显的吸收峰。合成萤石样品则分别观察到一个强反射峰和一系列吸收峰。

    Figure  4.  UV-Vis spectra of natural and synthetic fluorite samples

    合成紫色萤石样品SFPA的紫外-可见吸收光谱中可观察到在320、360、424、460、520、570、675、739、797、861 nm和892 nm的一系列吸收峰,这些吸收峰均为Nd3+的吸收[4],表明其掺杂的Nd元素主要以Nd3+的形式存在,是该萤石样品的致色元素。合成无色萤石样品SFA的紫外-可见吸收光谱在425 nm附近产生了一个极强的宽荧光峰,这与Eu2+的发射光谱一致[5-8],同时样品在仪器样品仓上表现出强烈的紫色荧光,可以判断紫外-可见光谱仪光源中的氘灯产生的紫外线激发了该萤石的荧光。

    萤石在中红外区有较好的透光性,通常无明显的吸收峰和反射峰。使用红外光谱仪测试萤石样品的红外反射光谱及透射光谱。结果显示,所有样品均无明显红外反射峰,4种萤石样品的红外透射光谱显示出了良好的差异性(图 5)。

    Figure  5.  Infrared spectra of natural and synthetic fluorite samples

    合成萤石与天然萤石的红外光谱中最显著的差异在于两个部分。天然无色萤石样品FA和紫色萤石样品FPA均存在位于1 463 cm-1和1 657 cm-1处由CO32-和羰基伸缩振动产生的吸收峰[9-12],而合成萤石通常经过高温处理,并未观察到对应的吸收峰;天然无色样品FA和紫色萤石样品FPA均可观察到3 400 cm-1与5 200 cm-1附近羟基伸缩振动产生的宽吸收谱带[13-14],而在合成萤石样品SFPA和SFA中未观察到,可能也是由于天然萤石在合成过程中需要经过高温处理而不会存在显著的水峰。天然紫色萤石样品FPA还可观察到位于2 147 cm-1处由CO分子伸缩振动产生的吸收峰[15]和2 344 cm-1处由CO2分子反对称伸缩振动产生的吸收峰[16-17],这可能来自于天然萤石内部的包裹体。

    此外,合成萤石中还观察到前人研究中几乎未曾记录过的吸收峰,这些吸收峰的出现可能是因为高含量的稀土离子掺杂所致。例如,合成紫色萤石样品SFPA的红外光谱中有3组明显的吸收峰,分别位于1 700~2 500 cm-1,3 400~4 500 cm-1和5 700~6 400 cm-1。Varsanyi等[18]的研究表明,Nd3+4I13/2能级和4I15/2能级会分别在3 932~4 045 cm-1和5 870~ 6 154 cm-1处产生吸收峰,因此3 400~4 500 cm-1和5 700~6 400 cm-1处的吸收峰可能为掺杂的Nd3+导致。此外,3 960 cm-1处的吸收峰也可能归属于HF分子[19],考虑到合成过程的高温环境,该可能性较低。合成无色萤石样品SFA的红外吸收峰较弱,在1 710 cm-1和1 741 cm-1处可观察到两处吸收峰,通常这两处吸收峰分别归属于酮羰基和酯羰基[20-22],但未观察到可能关联的-CH3伸缩振动;2 500~3 200 cm-1和4 550~5 200 cm-1间分别有两组尖锐的弱吸收峰,同样未见相关资料提及,可能与Eu2+的掺杂有关。

    天然萤石样品中的水及分子气体包裹体在红外透射光谱中可明显观察到,与合成萤石样品构成显著差异,后者的吸收峰位置非常不经典,可作为排除天然性的鉴定依据。

    光致发光光谱测试使用325 nm紫外激发光源,并配备专用的奥林巴斯LMU-15X-NUV物镜,可以获得高质量光致发光光谱,这对于研究经典的CaF2发光体系是必要的。本文萤石样品的光致发光光谱非常复杂,如图 6所示。

    Figure  6.  PL spectra of fluorite samples: (a)sample SFPA; (b)sample SFA; (c)sample FPA; (d)sample FA

    合成紫色萤石样品SFPA的光致发光光谱与常见天然萤石的光致发光光谱相比,前者的构成非常复杂,激发峰数量相对较多,这与合成萤石中各稀土元素含量均较天然萤石显著偏高有关。其中,357 nm处的激发峰为Ce3+-F-2D3/22F7/2的退激发[23-24];位于383 nm处的峰归属于Gd3+7F05G4跃迁[25];位于420 nm和837 nm处的峰归属于Eu2+的4f65d1→4f7的能级跃迁和4f65d→4f7的能级跃迁,即8S7/2跃迁[5-7];位于450 nm处的峰归属于Tm3+1D23F4跃迁[26];位于471 nm处的峰归属于Pr3+3H43P1跃迁[27];位于497、588 nm和630 nm处的峰分别归属于Tb3+5D47F65D47F45D47F3跃迁 [28];位于516 nm处的峰归属于Yb3+2F5/22F7/2跃迁[29];位于544 nm处的峰归属于Er3+4S3/24I15/2跃迁[30-32];位于574 nm处的峰归属于Eu3+5D07F0跃迁[7];位于599 nm处的峰归属于Sm3+4G5/26H7/2跃迁[33];位于684、698、725、731、761 nm和796 nm处的峰分别归属于Sm2+5D07F05D07F15D07F25D07F25D07F35D07F4跃迁[33];位于863、866、879、885 nm和921 nm处的峰均归属于Nd3+4F3/24I9/2跃迁[33-34]。除光致发光光谱复杂外,合成萤石样品中Gd3+和引发的激发峰在天然萤石中也较为少见。

    合成无色萤石样品SFA的光致发光光谱主要由最强峰位于422 nm和838 nm的两处宽峰组成,来自Eu2+8S7/2跃迁[5-8]。此外,可观察到590 nm附近有数个弱峰,使用532 nm激发光源对该样品进行再次测试,可以观察到一系列激发峰。其中,位于549、550、552 nm和554 nm处的弱激发峰归属于Er3+4S3/24I15/2跃迁[30-32];位于578、581、586 nm处的强激发峰归属于Dy3+4F9/26H13/2跃迁[33, 35-36];位于589、590、592 nm处的强激发峰归属于Eu3+5D07F1跃迁[7, 37-38];位于613、616、624 nm处的强激发峰归属于Eu3+5D07F2跃迁[7, 37-38];位于646、648、652 nm处的强激发峰归属于Eu3+5D07F3跃迁[7, 37-38]。由此可见,合成无色萤石样品和合成紫色萤石样品中掺杂的Eu元素部分以Eu3+的形式存在。

    天然紫色萤石样品FPA的光致发光光谱激发峰数量比合成紫色萤石样品SFPA明显偏少。其中位于354 nm处的峰归属于Ce3+-F-2D3/22F7/2的退激发[23-24];391 nm处的峰归属于Pr3+1S01I6跃迁[39];416 nm和832 nm处的峰归属于Eu2+中的8S7/2跃迁[5-8];448 nm处的峰归属于Tm3+1D23F4跃迁[26];521 nm处的峰归属于Yb3+2F5/22F7/2跃迁[29];575 nm处的峰归属于Eu3+5D07F0跃迁[7];701 nm处的峰与Sm2+5D07F0跃迁的零声子线有关[33];717 nm处的峰则归属于Sm2+5D07F1跃迁[33]

    天然无色萤石样品FA的光致发光光谱激发峰则相对少,位于420 nm处的峰归属于Eu2+中的4f65d1→4f7的能级跃迁[5-7];452 nm处的峰归属于Tm3+1D23F4跃迁[26];522 nm处的峰归属于Yb3+2F5/22F7/2跃迁[29];575 nm和617 nm处的峰分别归属于Eu3+5D07F1跃迁和5D07F2跃迁[7, 37-38]。综上,天然萤石的激发峰数量通常相对较少,强度通常相对较弱,可用于佐证其是否天然。

    (1) 本研究合成萤石样品内部干净,未见流体包裹体特征,而天然萤石样品中可见大量气液两相包裹体,这与红外光谱的测试结果相一致,即合成萤石中不存在天然萤石中的气液包裹体而在红外透射光谱中缺少CO32-、CO2、羟基和水相关的振动峰,是鉴别合成萤石与天然萤石的重要依据。

    (2) fs-LA-ICP-MS测试结果显示合成无色萤石样品中的Eu元素含量及合成紫色萤石中的Nd元素含量均较高,其中Eu及Nd元素可用XRF检出,具有一定的实用性;合成萤石样品中各稀土元素及合成紫色萤石样品中Ga、Ge、As的含量均较天然萤石样品的高,可作为鉴别依据,但常规测试难以检出。尽管合成萤石样品中Na、Mg、Si、Sr元素较所测天然萤石样品的偏高,但由于这些元素在天然萤石中含量波动较大,不宜作为鉴别依据。

    (3) 紫外-可见光谱结果显示,天然萤石样品的透过率极高,而掺杂了较多Nd元素的合成萤石样品可明显观察到Nd3+的吸收峰;掺杂了高含量Eu元素的合成萤石则可观察到强烈的荧光峰,与其在紫外荧光灯下的强荧光现象一致。

    (4) 合成紫色萤石样品的光致发光光谱较天然萤石样品的更为复杂,这与fs-LA-ICP-MS测试中展现的合成萤石较高的REE含量有显著的关联性;合成无色萤石的光致发光光谱则表现出了极强的荧光强度。

  • [1]
    He J F, Chen H, Zhang M M, et al. Combined inhibitors of Fe3+, Cu2+ or Al3+ and sodium silicate on the flotation of fluorite and quartz[J]. Colloids and Surfaces A: Physicochemical and Engineering Aspects, 2022(643): 128 702.
    [2]
    Crowther J. Ultraviolet fluorescence photography-Choosing the correct filters for imaging[J]. Journal of Imaging, 2022: 8(6): 162. doi: 10.3390/jimaging8060162
    [3]
    孙益坚, 张宇, 柯于球. 萤石矿物LA-ICP-MS微区分析标准物质研制及激光剥蚀行为调控[C]//第十八届全国稀土分析测试学术研讨会. 秭归, 2021.

    Sun Y J, Zhang Y, Ke Y Q. Development of LA-ICP-MS standard material and control and adjustment of laser ablation behavior for micro area analysis of fluorite[C]// The 18th National Symposium on Rare Earth Analysis and Testing. Zigui, 2021. (in Chinese)
    [4]
    Sils J, Hausfeld S, Clauss W, et al. Impurities in synthetic fluorite for deep ultraviolet optical applications[J]. Journal of Applied Physics, 2009, 106(6): 063 109. doi: 10.1063/1.3224879
    [5]
    Singh V S, Joshi C P, Moharil S V, et al. Modification of luminescence spectra of CaF2: Eu2+[J]. Luminescence, 2015, 30(7): 1 101-1 105. doi: 10.1002/bio.2865
    [6]
    Dorenbos P. Energy of the first 4f7→4f65d transition of Eu2+ in inorganic compounds[J]. Journal of Luminescence, 2003, 104(4): 239-260. doi: 10.1016/S0022-2313(03)00078-4
    [7]
    Pandey C, Dhopte S M, Muthal P L, et al. Eu3+ Eu2+ redox reactions in bulk and nano CaF2: Eu[J]. Radiation Effects and Defects in Solids, 2007, 162(9): 651-658. doi: 10.1080/10420150701197547
    [8]
    Berezovskaya I V, Dotsenko V P, Voloshinovskii A S, et al. Near infrared emission of Eu2+ ions in Ca3Sc2Si3O12[J]. Chemical Physics Letters, 2013(585): 11-14.
    [9]
    Veerasingam S, Venkatachalapathy R. Assessment of carbonate concentration and characterization of marine sediments by fourier transform infrared spectroscopy[J]. Infrared Physics & Technology, 2014(66): 136-140.
    [10]
    Ehlert M, Radtke A, Bartmański M, et al. Evaluation of the cathodic electrodeposition effectiveness of the hydroxyapatite layer used in surface modification of Ti6Al4V-based biomaterials[J]. Materials, 2022, 15(19): 6 925. doi: 10.3390/ma15196925
    [11]
    Kovalgin A Y, Chabert-Rocabois F, Hitchman M L, et al. A study by in situ FTIR spectroscopy of the decomposition of precursors for the MOCVD of high temperature superconductors[J]. Journal De Physique Ⅳ, 1995, 5(C5): C5-357-C5-364.
    [12]
    Renuga Devi T S, Gayathri S. FTIR and FT-Raman spectral analysis of Paclitaxel drugs[J]. International Journal of Pharmaceutical Sciences Review and Research, 2010, 2(2): 106-110.
    [13]
    King P L, McMillan P F, Moore G M. Infrared spectroscopy of silicate glasses with application to natural systems[M]. Ottawa: Mineralogical Association of Canada, 2004: 93-133.
    [14]
    Patel H A, Somani R S, Bajaj H C, et al. Nanoclays for polymer nanocomposites, paints, inks, greases and cosmetics formulations, drug delivery vehicle and waste water treatment[J]. Bulletin of Materials Science, 2006(29) : 133-145.
    [15]
    Barinov S M, Rau J V, Cesaro S N, et al. Carbonate release from carbonated hydroxyapatite in the wide temperature rage[J]. Journal Material Science Materials in Medicine, 2006, 17(7): 597-604. doi: 10.1007/s10856-006-9221-y
    [16]
    Schott J A, Do-Thanh C, Shan W, et al. FTIR investigation of the interfacial properties and mechanisms of CO2 sorption in porous ionic liquids[J]. Green Chemical Engineering, 2021, 2(4): 392-401. doi: 10.1016/j.gce.2021.09.003
    [17]
    Strazzulla G, Brucato J R, Palumbo M E, et al. Is it possible to detect frozen O2 and N2 on interstellar grains?[J]. Astronomy and Astrophysics, 1997, 321(2): 618-624.
    [18]
    Varsanyi F, Dieke G H. Infrared absorption spectrum of NdCl3[J]. Journal of Chemical Physics, 1960, 33 (6): 1 616-1 618. doi: 10.1063/1.1731471
    [19]
    Lignell H, Khriachtchev L, Lignell A, et al. Local formation of HArF in solid argon: Low-temperature limit and thermal activation[J]. Low Temperature Physics, 2010, 36 (5): 400-406. doi: 10.1063/1.3432248
    [20]
    Giorcelli M, Bartoli M. Development of coffee biochar filler for the production of electrical conductive reinforced plastic[J]. Polymers, 2019, 11(12): 1 916. doi: 10.3390/polym11121916
    [21]
    Fu X, Kong W, Zhang Y, et al. Novel solid-solid phase change materials with biodegradable trihydroxy surfactants for thermal energy storage[J]. RSC Advances, 2015, 5(84): 68 881- 68 889. doi: 10.1039/C5RA11842E
    [22]
    Yang R, Li Y, Yu J. Photo-stabilization of linear low density polyethylene by inorganic nano-particles[J]. Polymer Degradation and Stability, 2005, 88(2): 168-174. doi: 10.1016/j.polymdegradstab.2003.12.005
    [23]
    Kozłowski A, Wiszniewska J, Sikorska M. Fluid inclusions and cathodoluminescence of fluorite from carbonatites of the Tajno massif, NE Poland[J]. Mineralogical Society of Poland Special Papers, 2005(26): 40-46.
    [24]
    Caldiño U. Energy transfer in CaF2 doped with Ce3+, Eu2+ and Mn2+ ions[J]. Journal of Physics: Condensed Matter, 2003, 15(41): 7 127-7 137. doi: 10.1088/0953-8984/15/41/020
    [25]
    Singh B P, Parchur A K, Ningthoujam R S, et al. Enhanced photoluminescence in CaMoO4: Eu3+ by Gd3+ co-doping[J]. Dalton Transactions, 2014, 43(12): 4 779-4 789. doi: 10.1039/c3dt53408a
    [26]
    Tao L, Zhou B, Jin W, et al. Improved multiphoton ultraviolet upconversion photoluminescence in ultrasmall core-shell nanocrystals[J]. Optics Letters, 2014, 39(21): 6 265-6 268. doi: 10.1364/OL.39.006265
    [27]
    Serrano D, Braud A, Doualan J L, et al. Pr3+ cluster management in CaF2 by codoping with Lu3+ or Yb3+ for visible lasers and quantum down-converters[J]. Journal of the Optical Society of America B, 2012, 29(8): 1 854-1 862. doi: 10.1364/JOSAB.29.001854
    [28]
    Zhao B, Shen D, Tan Q, et al. Morphology-controllable synthesis, energy transfer and luminescence properties of Ce3+/Tb3+/Eu3+-doped CaF2 microcrystals[J]. Journal of Materials Science, 2017(52): 5 857-5 870.
    [29]
    Guo J, Dong Y, Li Y, et al. Structural destruction quenching of down- and upconversion emission in CaF2: Yb3+, Tb3+ [J]. Materials Research Express, 2017, 4(11): 116 201. doi: 10.1088/2053-1591/aa96c0
    [30]
    Balabhadra S, Reid M F, Golovko V, et al. Absorption spectra, defect site distribution and upconversion excitation spectra of CaF2/SrF2/BaF2: Yb3+: Er3+ nanoparticles[J]. Journal of Alloys and Compounds, 2020(834): 155 165.
    [31]
    Yang Y, Li W, Mei B, et al. Synthesis and enhanced upconversion luminescence upon two-wavelength excitation of Er3+: CaF2 transparent ceramics[J]. Journal of Luminescence, 2019(213): 504-509.
    [32]
    Cantelar E, Lifante-Pedrola G, Quintanilla M, et al. Spectroscopic characterization of Er3+-doped CaF2 nanoparticles: Luminescence concentration quenching, radiation trapping and transition probabilities[J]. Journal of Alloys and Compounds, 2023(954): 170 192.
    [33]
    Czaja M, Bodył-Gajowska S, Lisiecki R, et al. The luminescence properties of rare-earth ions in natural fluorite[J]. Phys Chem Minerals, 2012(39): 639-648.
    [34]
    Babu B H, Billotte T, Lyu C, et al. Study of femtosecond laser writing in the bulk of Nd3+, Y3+ co-doped CaF2 crystals[J]. OSA Continuum, 2019, 2(1): 151-161. doi: 10.1364/OSAC.2.000151
    [35]
    Gao X, Fang G, Wang Y, et al. Visible and mid-infrared spectral performances of Dy3+: CaF2 and Dy3+/ Y3+: CaF2 crystals[J]. Journal of Alloys and Compounds, 2021(856): 158 083.
    [36]
    Zhu L, Zuo C, Luo Z, et al. Photoluminescence of Dy3+ and Sm3+: SiO2-Al2O3-LiF-CaF2 glasses[J]. Physica B: Condensed Matter, 2010, 405(21): 4 401-4 406. doi: 10.1016/j.physb.2010.07.039
    [37]
    Danilkin M I, Belousov A P, Klimonskii S O. et al. Formation of Eu2+ and Eu3+ centers in synthesis of CaF2: Eu luminophores[J]. Journal of Applied Spectroscoscopy, 2007(74), 858-865. doi: 10.1007/s10812-007-0133-5
    [38]
    Liu X, Li Y, Aidilibike T, et al. Pure red upconversion emission from CaF2: Yb3+/Eu3+[J]. Journal of Luminescence, 2017(185): 247-250.
    [39]
    Boiaryntseva I A, Shiran N V, Gektin A V, et al. 1S0-luminescence in Ca1-xPrxF2+x crystals[J]. Functional Materials, 2012, 19(2): 192-196.

Catalog

    Figures(6)  /  Tables(2)

    Article Metrics

    Article views (35) PDF downloads (28) Cited by()
    Related

    /

    DownLoad:  Full-Size Img  PowerPoint
    Return
    Return